Investors routinely, seemingly instinctually, look to the past for clues to qualify the present and gauge the future. We certainly place a great deal of weight on, for example, characteristics of individual stocks that have tended to lead to longer-term outperformance. But past as proxy for long-term expectations seems to us far more defensible than past as prognosis for what’s to come over the next few months. We regularly encounter Given This, This Happens commentary that’s meant to inform portfolio decisions. Conditions vary sufficiently over the short and medium terms, though, that these simple historical cause-effect reviews generally miss matters and events that complicate current prognoses.
- It’s impossible to fully contextualize history. So, folks generally use a shorthand approach that considers some specific conditions as pretext and assumes everything else is the same or does not matter
- But ceteris paribus (all things otherwise the same) is an unreasonable assumption
- We therefore do not believe such causal analysis should inform dramatic portfolio shifts
- Still, the past can be used to prepare for a range of outcomes near- and long-term, with the appropriately honest context and expectation that all other things never are the same
The “Perfect” Record
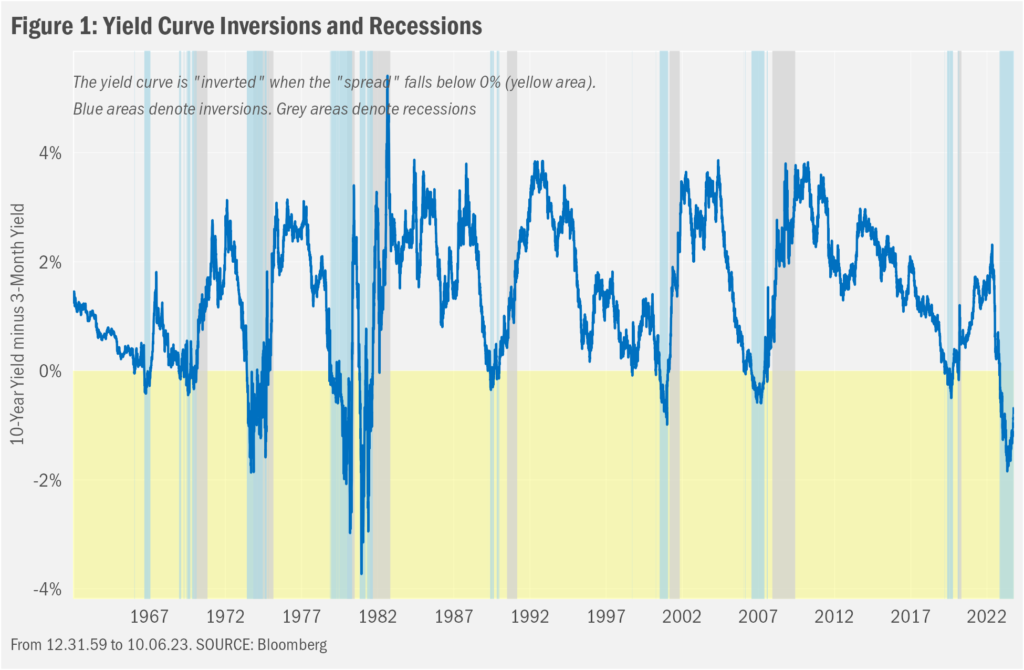
Wall Street loves a record, especially one with “predictive” power. Lately, investors have been keenly focused on the “inversion” of the U.S. Treasury market yield curve for its presumed prowess predicting recessions. A casual review of the data supports that belief. Normally, the yield curve, or interest rates charted at increasingly longer-term maturities, is “upward sloping,” meaning that longer-term interest rates are normally higher than short-term interest rates because longer-term investors generally are taking on more interest rate risk (for a given level of credit risk). Before each of the past eight U.S. recessions, however, the curve has been inverted, meaning short-term rates were instead higher than longer-term rates. In Figure 1, we chart these data. And with the exception of a head fake in the mid-1960s (a “miss” that does not show up when one compares the 10-year yield to the 2-year yield, another common spread measure), this relationship has proved consistent.
Ceteris Paribus?
It’s commonly thought that the yield curve inverts upon growing investor belief that shorter-term interest rates will fall. This shift may come about if, using an example quite relevant to present conversation, the Federal Reserve finds need to cut its target for short-term interest rates (the federal funds target, which is the rate that banks lend money to each other overnight) in order to bolster macroeconomic activity in the face of a forthcoming recession. The Federal Reserve Bank of Chicago expands on this shorthand, noting that, “…the yield curve is influenced by more than monetary policy expectations. In particular, the yield curve also reflects market attitudes toward various risks, and these too are influenced by economic outcomes. If the differences between the long-run and short-run values for either policy expectations or risk factors reflect market assessments of the probability of a recession in the future, then—to the degree these assessments are either correct or self-fulfilling—they will be useful in forecasting recessions.”
So that’s it, then, right? Recession is imminent. While we know we’ll face a recession in the future at some point, we’re not entirely convinced it’s just about to occur. Our hesitation to suggest a recession is imminent based solely on the inversion signal considers a few notable qualities of the signal itself.
First, the inversion reflects math that relates just two time series: a short-term bond yield (in most cases, the 3-month Treasury or the 2-Year Treasury) and a long-term bond yield (in most cases the 10-year Treasury). Making a recession call and, in turn, altering portfolio exposures as a result, using the interaction of just two numbers might seem a bit hasty. The counterpoint to that statement, just as the Federal Reserve noted in the piece referenced above: an enormous amount of information is embedded in those two numbers. So, the data are valuable, but the jury is still out re: why (depending on whom you ask, of course; so confident are so many in financial circles). That is, looking at the numbers alone leaves out all the context that exists within the numbers. Combining the breadth of drivers of yield curve inversion (the infinite machinery of the universe) with the dearth of examples (just eight), and one cannot wave away the fact that each situation is unique and that there are few constants across many, let alone all past inversions. So, a grand thesis as to what drives inversions and why the inversion signal might be accurate by its nature or by chance remains elusive.
Tempora Mutantur
Consider some examples. There exists a wide range of time between the onsets of historical inversions and the onsets of the following recessions. After the curve inverted on June 6, 1973, a recession began only 5 months later. But it took well more than two years after the curve inverted in September 1998 before a recession started. Even if we allow for the fact that inversions tend to wobble a bit about the zero line at the beginning before deepening, Figure 1 shows there’s generally still a pretty large range of time between onset of the inversion and the onset of the ensuing recession.
Also interesting, the first four inversions in the series overlapped with the beginning of the recession. The latter four inversions ended prior to the recession. Even more, the yield curve inversion that started in March 2019 arrived and completed well before the COVID-19 pandemic to which we might more confidently attribute the short recession of 2020. We’re pretty sure no bond investors during the earlier part of that inversion foresaw the extent to which measures to thwart the spread of COVID-19 would dampen the global economy. One might think similarly of the factors that influenced the recessions of 2001 and 2007-09. These inversions started well before each ensuing recession, seemingly prompted by investor contention that something was up and that it was only a matter of time before something would break (we certainly hear such concerns now). In 2001, the Technology Stock Bubble burst. In 2007, the Housing Bubble burst.
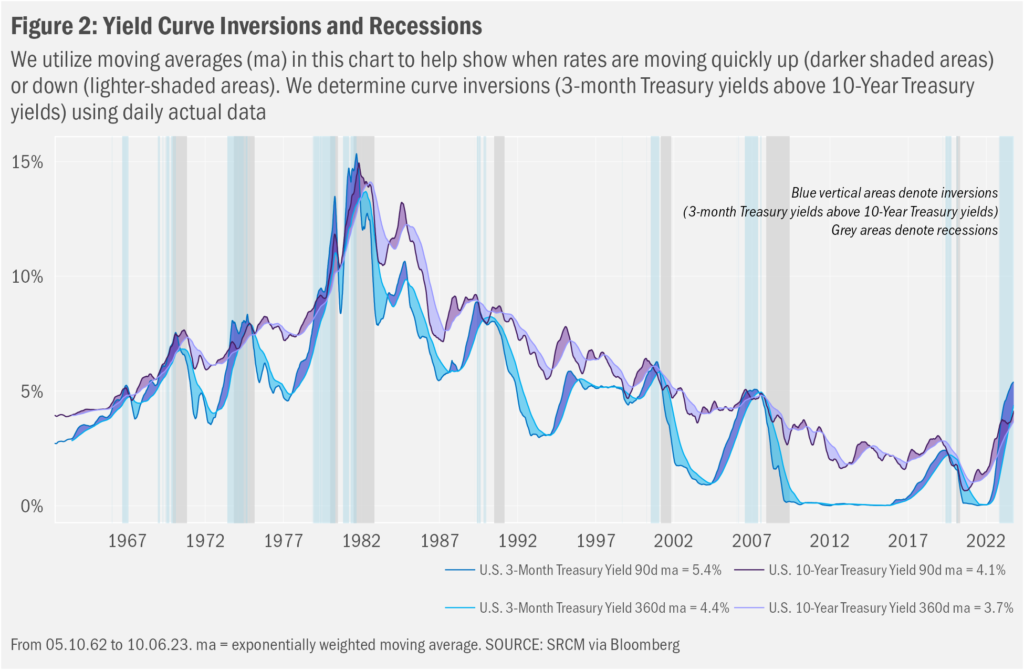
There are other characteristics distinct between those two groups of four. In Figure 2, we use rather more complicated moving average charts to highlight the differences in the paces of change for the 3-month yield and the 10-year yield (it’s very busy, but what a pretty chart!!!). Upon review, we see that rates soared during the four inversions prior to the 1990s, but trended flat to downward during the four recessions thereafter (FYI that this time around seems much like the earlier quartet in form). In both those cases, the signal eventually proved accurate. And those two scenarios actually rhyme a bit in their being associated with frothy markets.
Mutatis Mutandis?
Whether these parallels and distinctions and have meaning seems impossible to know. But those quick, potentially meaningless (but maybe not!) points of reference begin to reveal our general problems with rule-of-thumb takes on relatively simple reviews of data that are influenced by myriad factors (i.e., most macroeconomic data). Foremost, there are just too few examples and far too many flavors to know what’s relevant to past situations, let alone what’s meaningful to the present environment and, in turn, what decisions we need make as a result.
And while this-therefore-that forecasts surely make for eye- and ear-catching commentary, we have found that they tend to provide weak bases for portfolio decisions. Reminding many of the challenges one faces when predicting shifts in the yield curve, the latest inversion has begun to abate. It’s done so via a recent surge in longer-term rates, even as very short-term rates held relatively steady. Given the relative stability on the front of the curve it would seem that investors believe the Federal Reserve is likely to leave policy targets where they are for the time being—much as they have stated—with perhaps some modest additional tightening tweaks, to ensure that inflation truly has been tamed.
So, a bit of status quo for short-term rates. On the contrary, the surge in longer-term rates has proved more impactful. Consider all the folks demanding earlier in the year that the present, now much longer in the tooth, inversion surely meant a recession was forthcoming and that investors therefore should buy longer-term bonds in order to take advantage of the price gains that would come on the heels of the Federal Reserve’s having needed to transition to lowering rates in order to stem the negative tide. Since bond prices move in the opposite direction of yields, and since the extent of those price moves vary in proportion to the duration of the bond (the longer the time to maturity the more dramatic the price moves), folks who shifted funds to longer-term maturities over the summer likely have seen dramatic drops in the values of their bond holdings as yields surged from the lower-mid 3% range to nearly or even more than 5% across maturities longer than a year.
But what’s prompted the disinversion? Problematically, at least for those looking for a tidy explanation, one can substantiate this shift for a range of sometimes contradictory reasons. Investors might believe that inflation will remain higher for a longer time, such that the Federal Reserve might need to remain restrictive in its monetary policy stance seeking to keep downward pressure on prices. This belief is not strongly supported by recent trends in inflation, though there remains the potential for easing inflation trends to slow, even reverse. Investors might otherwise believe inflation has been tamed, and that better economic times lie ahead such that higher rates are warranted on account of higher expectations for growth. Still others might believe that we are emerging from a long period of unnaturally depressed interest rates and that the yield curve will evolve to look like it did prior to the Great Financial Crisis of 2008-09 or even earlier.
Meantime, some investors may be weighing increasingly risky U.S. government’s finances and the likely increase in Treasury issuance that will about as a result. These folks might not be as willing to buy American bonds before demanding greater compensation for those growing risks by insisting on higher yields. In addition to solvency risks, investors could be concerned about domestic political risks, too. And as trends in interest rates have remained quite volatile, investors also could be demanding higher yields simply due to that increased instability.
And it may well be the case that individual investors place some weight on all the above explanations.
Omnia Mutantur
Further complicating efforts to read market tea leaves and time yield curve swings, the broader macroeconomic and market environment has proved both stable and shifty in different ways at different times such that most folks who have been maintaining a particular shorter-term stance through the year may have felt entirely wrong at one point or another.
Case in point, economist Campbell Harvey, now a professor at Duke University’s Fuqua School of Business, in his 1986 dissertation linked yield curve inversions to recessions, perhaps among first persons to have done so. In an early January interview with Bloomberg, Professor Harvey was quoted as saying, “My yield-curve indicator has gone code red, and it’s eight for eight in forecasting recessions since 1968—with no false alarms.” Reflecting this month’s theme, he furthered, “I have reasons to believe, however, that it is flashing a false signal.” The story offered some of his thinking as to how this time might be different: he imagines folks think sufficiently highly of the metric that it alters behaviors, that the domestic job picture remained positive and that inflation expectations continue to ease. These and other factors, he believed at the time, might allow the U.S. to avoid recession.
This past June, though, Professor Harvey, also a researcher at investment firm Research Affiliates, presented broadly different thoughts in a commentary for that firm: “Although the Fed is unlikely to raise rates in June, the reprieve will probably be short-lived. Damage has been done, and the expected further hikes mean more damage. The recession we are imminently facing is self-inflicted.” To be fair, memories of the banking crisis a bit earlier in the year were still fresh for most, so additional caution may have seemed warranted at the time. Indeed, that crisis could have pulled the economist away from his thoughts in January this year that, also quoted in that earlier Bloomberg article, “When you put all this together it suggests we could dodge the bullet.”
But for how long? There will, of course, be another recession at some point in the future. And we can imagine someone a few decades hence looking back upon this period—ignoring any complicating details that might arise between today and that eventual recession—and counting the current recessionary signal the inverted curve presents a part of its “perfect” record.
Important Information
Signature Resources Capital Management, LLC (SRCM) is a Registered Investment Advisor. Registration of an investment adviser does not imply any specific level of skill or training. The information contained herein has been prepared solely for informational purposes. It is not intended as and should not be used to provide investment advice and is not an offer to buy or sell any security or to participate in any trading strategy. Any decision to utilize the services described herein should be made after reviewing such definitive investment management agreement and SRCM’s Form ADV Part 2A and 2Bs and conducting such due diligence as the client deems necessary and consulting the client’s own legal, accounting and tax advisors in order to make an independent determination of the suitability and consequences of SRCM services. Any portfolio with SRCM involves significant risk, including a complete loss of capital. The applicable definitive investment management agreement and Form ADV Part 2 contains a more thorough discussion of risk and conflict, which should be carefully reviewed prior to making any investment decision. All data presented herein is unaudited, subject to revision by SRCM, and is provided solely as a guide to current expectations.
The opinions expressed herein are those of SRCM as of the date of writing and are subject to change. The material is based on SRCM proprietary research and analysis of global markets and investing. The information and/or analysis contained in this material have been compiled, or arrived at, from sources believed to be reliable; however, SRCM does not make any representation as to their accuracy or completeness and does not accept liability for any loss arising from the use hereof. Some internally generated information may be considered theoretical in nature and is subject to inherent limitations associated thereby. Any market exposures referenced may or may not be represented in portfolios of clients of SRCM or its affiliates, and do not represent all securities purchased, sold or recommended for client accounts. The reader should not assume that any investments in market exposures identified or described were or will be profitable. The information in this material may contain projections or other forward-looking statements regarding future events, targets or expectations, and are current as of the date indicated. There is no assurance that such events or targets will be achieved. Thus, potential outcomes may be significantly different. This material is not intended as and should not be used to provide investment advice and is not an offer to sell a security or a solicitation or an offer, or a recommendation, to buy a security. Investors should consult with an advisor to determine the appropriate investment vehicle.