Last month we spoke to the relatively rare occasions that U.S. stock markets failed to show a gain by year’s end. The stark decline and the several failed attempts at a rebound in stocks last year were reminders that markets don’t always go up. Minimally, then, market activity in 2022 highlighted the “you lose” side of the return/risk coin that had flipped in favor of investors in each of the three years prior. But that non-subtle emphasis of an everlasting rule of investing wasn’t the only such reminder last year’s markets provided to investors. Among the other rules revisited in 2022 are:
- From an investing perspective, the second-order effects of heightened geopolitical risk may prove more impactful than the more obvious potential for or initiation of actual conflict
- All investing carries risk. Even “risk-free” U.S. Treasuries convey the risk of potential loss if not held to maturity
- Investors have returned to fundamentals time and again after having experienced arguably excess market/sector/style/stock gains
- The greater our expectations, the more likely those expectations will fail to be me
Inflation Took Center Stage
Were we to highlight the investor focus of 2022, it would be inflation. Having entered last year with inflation already in the mid-single digits, well above the 2% level that’s generally considered comfortable, inflation soared higher over the first half of the year. The continuation of a trend that began just after the onset of the COVID-19 pandemic caught by surprise those who thought higher rates of price increases were closely tied to supply-chain bottlenecks wrought by the pandemic. Instead of petering out as the global economy returned to smoother running, though, inflation kept rising as Russia’s invasion of Ukraine added additional pressures to global supply chains, those petroleum-related in particular. And as workers bargained for higher wages to counter increased costs of living, their costs to employers rose. Some of those wage increases made their way down the supply chain to consumers, who were also seeing higher prices for homes they buy, apartments they rent and services they purchase. And it’s that last bit that demands the greater focus for monetary policy setters in 2023. Though inflation has begun to slow in the aggregate, the favorable shifts have come primarily from the goods side of the equation, with trends in wages and services still troublesome.
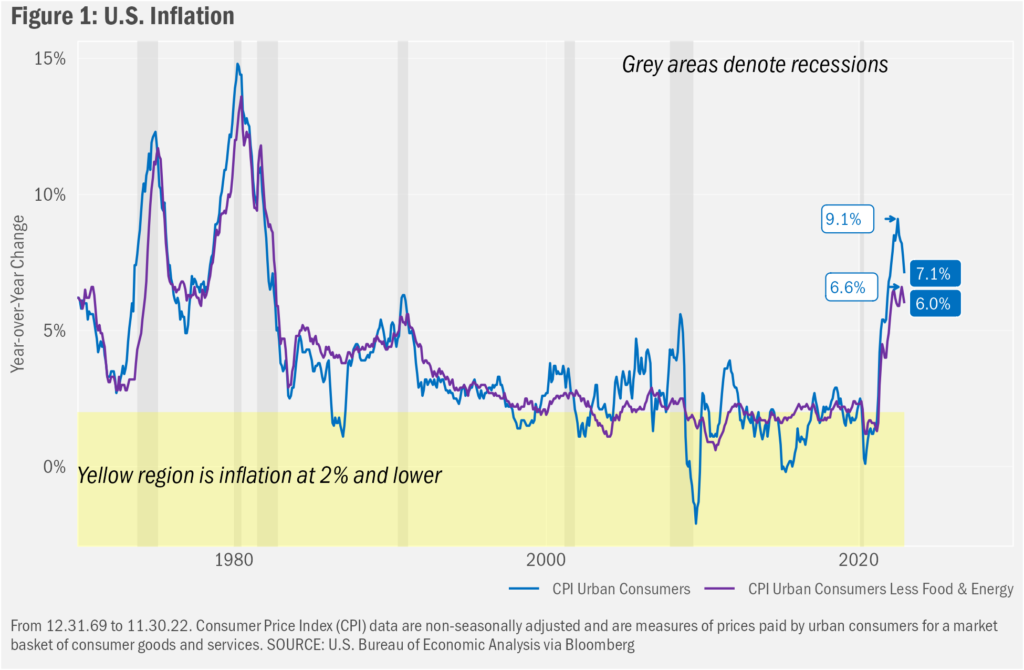
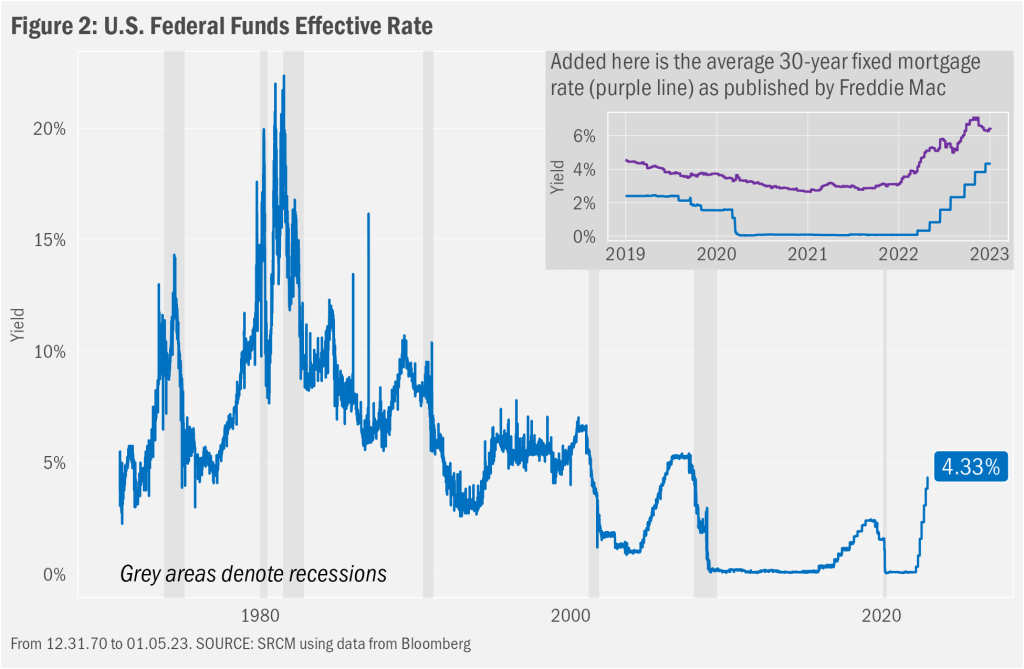
Given the still-well uncomfortable pace of price change, the Federal Reserve has reiterated (again and again in various ways) that it will remain focused in its efforts to tame inflation by dampening macroeconomic activity via higher interest rates. As a reminder, the Fed seeks to direct the broader interest rate environment by setting a target for the rate at which banks lend each other money overnight, or the federal funds rate. Changes in interest rates of all sorts—mortgage, auto loans, corporate bonds, etc.—tend to be reflective of changes in the Fed’s target for the federal funds rate. Higher fed funds target rates generally mean higher interest rates throughout the economy and upward shifts in rates tend to have a dampening effect on economic activity. For historical perspective, we’ve charted the effective fed funds rate, meaning the average rates at which banks actually did lend each other money overnight, in Figure 2. Clear from those data is the sharp increase since early 2022.
All Investing Carries Risk
And that steep rise, as we noted, has lifted interest rates across the economy. We included as an example 30-year fixed mortgage rates in the inset chart in Figure 2. Rates rose, though, not only for things we see as costs, such as home and auto loans. Yields rose on bonds, too, which we as investors see as income. Higher rates generally mean higher income on a going forward basis. Indeed, investors likely have welcomed yields of 4% or more they now might obtain by investing in fixed income. But that also meant owners of existing bonds likely saw the prices of those bonds fall, since bond prices move in the opposite direction of bond yields. Getting back to the list of reminders markets provided last year, then, we relearned that even relatively safe investments can see periods of substantial losses.
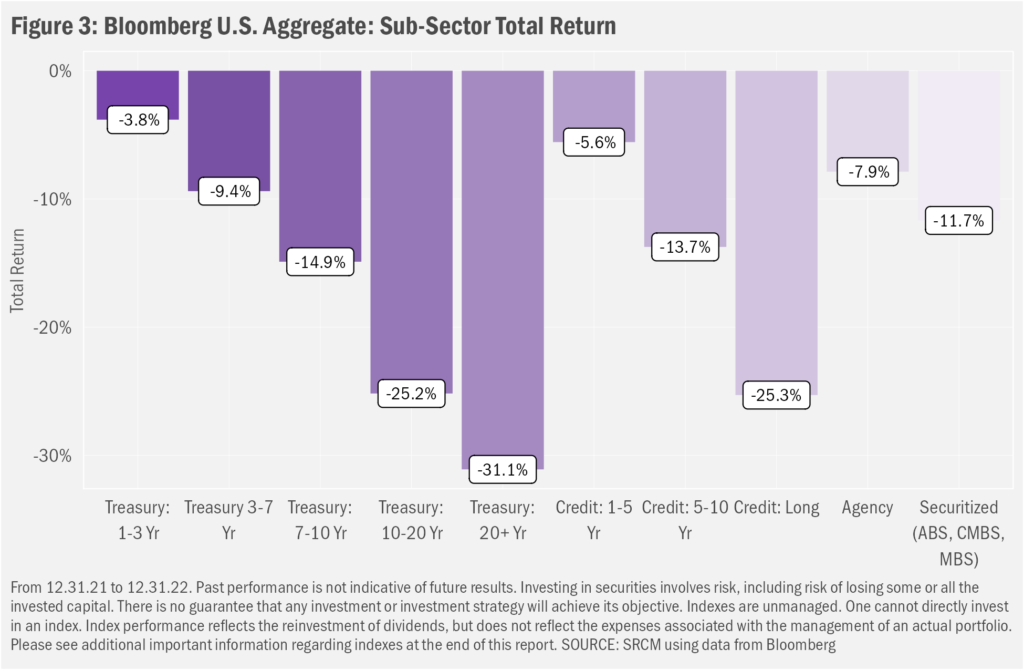
Take U.S. Treasury bonds. While U.S. Treasury securities are considered free of default risk, meaning the U.S. Government has always paid its debts, Treasuries are subject to interest rate risk from the time of purchase to maturity. And that means their prices will fluctuate along with the broader interest rate environment through maturity. And the longer the time to maturity, the more sensitive individual bonds are to changes in interest rates. And as we’ll show next, those rules left bond markets of most sorts reeling through much of 2022. In Figure 3 we present the across-the-board losses experienced in various segments of the U.S. investment grade bond market last year. The year was so bad, in fact, the interim drawdown from 08.06.20 through 10.24.22 of more than 18% for the Bloomberg U.S. Aggregate Index, the index that comprises the segments shown in the chart, was its largest in its history going back to the beginning of 1976. Not coincidentally, that decade saw the last time the Federal Reserve was raising rates to combat truly onerous rates of inflation (refer back to Figure 1).
Risk-Off Reassessment
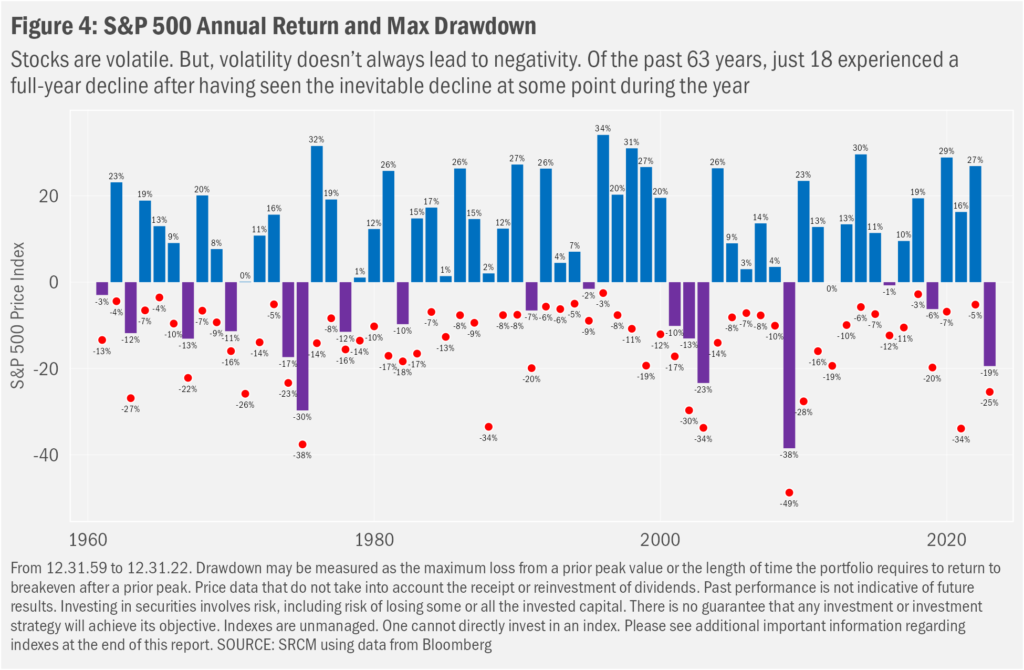
As we went to press with last month’s commentary in early December, the U.S. stock market had bounced nearly 9% off October lows. But Santa offered no gifts to investors this year. The market shortly thereafter saw a renewed sell-off, with the index closing down 19.4% for the year (18.1% if one includes the effects of the reinvestment of dividends). That’s the worst annual showing for the S&P 500 since its 38.5% plunge in 2008, and the decline left investors flat since about March 2021.
As one can see in Figure 4, full-year declines are rare. Sequential years of full-year declines have occurred only twice since 1959. But while folks are free to find reason for optimism in those odds, the lack of precedent should not leave investors with the belief that there’s nowhere to go but up for stocks this year. Sentiment readings suggest there may be few who hold such beliefs, actually. That, too, offers contrarian reasons for optimism. Even so, with inflation still roiling, monetary policy success uncertain, market volatility still on the elevated side of the spectrum, and geopolitical risk high and potentially still rising, we expect it may take some time for investors to regain the sorts of ebullience that fostered the rather bonkers market gains we saw from the bottom of the pandemic crush through New Years 2021. That is to suggest that investors may have lost some manner of their appetite for investment risk in light of last year’s market drama.
High Hopes, Low Odds
That shouldn’t seem so surprising. Not always true, but seemingly true more often than not, periods of prolonged market volatility seem to force investors to reassess portfolio exposure to risk—risks of all sorts, including those not-so obvious as general market instability. One risk that seemed mostly to have been ignored over the past decade or so, but which rose to the forefront of investor conversations last year, was that the futures for specific companies and even certain corporate business models might not turn out as rosy as earlier had been expected. Far worse-than-average declines in specific pockets of the stock market suggest investors seem to conclude that it might not be worth paying so dearly for shares in companies for which they could expect meaningful profits only very far off in the future. In investor parlance, “Growth” stocks, which means stocks that investors had bid up expecting distant future earnings growth to compensate for high share prices in the present, were “re-rated” to reflect the potential for not-so-great growth, in addition to likely lower certainty about that future growth. For comparison, the MSCI U.S. Investable Market 2500 Index, which is designed to measure the performance of the large-, mid- and small-cap stock within the U.S. equity market, lost 19.2% in 2022. However, splitting that broader index into two buckets—less-expensive and more-expensive stocks, in that order—we see that the Value component of that index dropped only 5.6%, while the Growth component sank 32.2% (index descriptions are available at the end of this report).
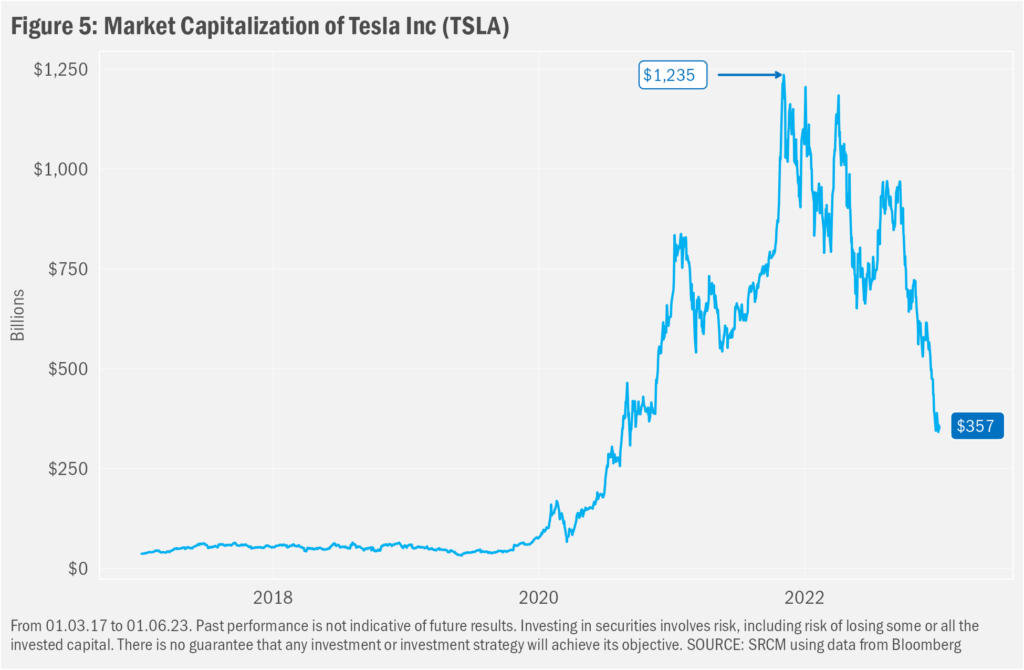
It didn’t help that marquee growth-oriented stories severely lagged investor expectations last year. Perhaps the most notorious fall from grace in 2022 was that of electric carmaker Telsa Inc. (TSLA). From a peak of more than $1.2 trillion dollars in November 2021, Tesla’s market capitalization has fallen to less than $360 billion as of 01.06.23 as the company’s stock price plunged in excess of 72%, a far more substantial drop than that of the broader market’s 16.8% decline over that period (for comparison, the market caps of Ford (F) and General Motors (GM) are about $50 billion each, with those stocks having dropped 35.2% and 38.8%, in that order, over the same time frame). Where Tesla’s valuation for a time could have been read as suggesting the company might take over the entire global car market, investors seem to be coming to the broader realization that Tesla is a carmaker not that much unlike any other carmaker. They are finding that the electric vehicle maker is subject to the same macroeconomic, competitive and cost pressures as all the others. And as a result, investors may be coming to believe that Tesla’s growth prospects, while still potentially relatively good...even great...they probably are not that great.
In faulting the share decline, one could argue that the Tesla story was tarnished by CEO Elon Musk’s tumultuous foray into social media via his takeover of Twitter. Fundamental issues likely were far more impactful, though. With truly competitive offerings now widely available from most auto makers across the range of vehicle classes and price ranges, Tesla ended the year with production and sales/pricing challenges in China, missed estimates for the number of cars that it would sell and much higher inventories than had been expected, despite having offered substantial breaks on list prices for new cars. There’s thus growing investor realization that Tesla’s was not on an unstoppable ramp to auto market domination. Hence the dramatic decline in the share price. We’re not convinced that its valuation is yet reasonable, but we now minimally find it perhaps a bit more rational.
2023 Will be Different
This time of year most folks wonder how we expect to see markets evolve through the year. We tend to start our responses with the stock answer: “Of course, we have no idea.” That doesn’t mean we don’t have a set of trends we believe will drive investor sentiment as we head further into 2023. Top of mid are: 1) global central bank focus on and success in dampening inflation, 2) continued rate volatility as the effects of changes in monetary policy work through the global economy, and 3) potential further emphasis on corporate fundamentals.
Inflation Fixation
Barring a dramatic turn in the geopolitical realm, we imagine all eyes will remain focused on inflation around the globe and the various efforts to tame it. True, recent trends have been favorable, but the world remains well inside the inflation forest. While we expect current trends that show an ongoing moderation in price pressures to continue, a stall in that progress or even a resurgence in inflation are not beyond possible in 2023. Investors therefore should expect market volatility to remain elevated over specific data releases, shifts in inflation trends and the evolution of global macroeconomic variables.
Rates in Flux
And by markets, we mean stocks and bonds, as interest rates are likely to remain volatile as well. Part of that thinking stems from the presently broad disconnect between shorter-term and longer-term interest rates. The yield curve is inverted, in finance speak, meaning investors believe in the aggregate that the Federal Reserve will need to reverse course on interest rates, turning to cuts as soon as later this year. The dominant narrative of the “why” of that belief is that investors believe the Federal Reserve’s policies already have or soon will become too restrictive, causing a recession. That the Fed, in turn, will need to cut rates in order to ameliorate the macroeconomic downturn that it arguably caused.
But that seems to us a pretty high-conviction, high-risk position for investors to have assumed. We think that’s not so likely. At least not so soon. Given recent trends, we believe the Federal Reserve will find that its policies are achieving the intended effect both of moderating macroeconomic activity in support of its goal of reducing the upward pressures on prices and thereby moderating inflation, while at the same time not causing too much damage to the broader economy. And that means to us that, for a longer time frame than presently expected, interest rates are likely to remain closer to rates on the front end of the yield curve—4.0% to 4.75%—than to rates for present yields on bonds maturing in 5 to 10 years (~3.75%).
While we otherwise might have welcomed the capital gains that might come along with a broad reduction in interest rates, we’d rather forego a recession and find that shorter-term rates remain anchored in their present range to bolster income on a going-forward basis.
Nod to Basics
It’d be silly for us to suggest that investors would more permanently shift their emphases back to a purer focus on company fundamentals, with undervalued shares continuing to see much stronger relative returns as a result. We’ve too often over the past decade found investors quick to return to what we see as poor habits given sufficient risk-on momentum. But we’ve found much of that momentum often to have been supported by monetary policies that, as we just noted, we don’t expect to return anytime soon, such that the investors are likely to find the stimulus for excess to remain quite limited. And that just might spell continued relatively better performance for the sorts of undervalued stocks we tend to prefer in our portfolios. It’s a take that’s obviously a bit self-serving, but it’s one we believe has a strong chance of proving true.
Important Information
Signature Resources Capital Management, LLC (SRCM) is a Registered Investment Advisor. Registration of an investment adviser does not imply any specific level of skill or training. The information contained herein has been prepared solely for informational purposes. It is not intended as and should not be used to provide investment advice and is not an offer to buy or sell any security or to participate in any trading strategy. Any decision to utilize the services described herein should be made after reviewing such definitive investment management agreement and SRCM’s Form ADV Part 2A and 2Bs and conducting such due diligence as the client deems necessary and consulting the client’s own legal, accounting and tax advisors in order to make an independent determination of the suitability and consequences of SRCM services. Any portfolio with SRCM involves significant risk, including a complete loss of capital. The applicable definitive investment management agreement and Form ADV Part 2 contains a more thorough discussion of risk and conflict, which should be carefully reviewed prior to making any investment decision. All data presented herein is unaudited, subject to revision by SRCM, and is provided solely as a guide to current expectations.
The opinions expressed herein are those of SRCM as of the date of writing and are subject to change. The material is based on SRCM proprietary research and analysis of global markets and investing. The information and/or analysis contained in this material have been compiled, or arrived at, from sources believed to be reliable; however, SRCM does not make any representation as to their accuracy or completeness and does not accept liability for any loss arising from the use hereof. Some internally generated information may be considered theoretical in nature and is subject to inherent limitations associated thereby. Any market exposures referenced may or may not be represented in portfolios of clients of SRCM or its affiliates, and do not represent all securities purchased, sold or recommended for client accounts. The reader should not assume that any investments in market exposures identified or described were or will be profitable. The information in this material may contain projections or other forward-looking statements regarding future events, targets or expectations, and are current as of the date indicated. There is no assurance that such events or targets will be achieved. Thus, potential outcomes may be significantly different. This material is not intended as and should not be used to provide investment advice and is not an offer to sell a security or a solicitation or an offer, or a recommendation, to buy a security. Investors should consult with an advisor to determine the appropriate investment vehicle.
The S&P 500 Index measures the performance of the large-cap segment of the U.S. equity market.
The MSCI U.S. Investable Market 2500 Index is designed to measure the performance of the large-, mid- and small-cap segment of the U.S. equity market. The index represents approximately 99% of the free float-adjusted market capitalization in the U.S. equity market. “Value” and “Growth” versions of this index are constructed as follows: The value investment style characteristics for MSCI index construction are de?ned using the following variables: book value to price, 12-month forward earnings to price and dividend yield. The growth investment style characteristics are defined using the following variables: long-term forward earnings per share (EPS) growth rate, short-term forward EPS growth rate, current internal growth rate, long-term historical EPS growth trend and long-term historical sales per share growth trend. The objective of the MSCI Value and Growth Indexes design is to divide constituents of an underlying market capitalization index into a value index and a growth index, each targeting 50% of the free float-adjusted market capitalization of the underlying index. The market capitalization of each constituent should be fully represented in the combination of the value index and the growth index, and, at the same time, should not be double-counted. One security may, however, be represented in both the value index and the growth index at a partial weight.
The MSCI information may only be used for your internal use, may not be reproduced or disseminated in any form and may not be used as a basis for or a component of any financial instruments or products or indices. None of the MSCI information is intended to constitute investment advice or a recommendation to make (or refrain from making) any kind of investment decision and may not be relied on as such. Historical data and analysis should not be taken as an indication or guarantee of any future performance analysis, forecast or prediction. The MSCI information is provided on an "as is" basis and the user of this information assumes the entire risk of any use made of this information. MSCI, each of its affiliates and each other person involved in or related to compiling, computing or creating any MSCI information (collectively, the "MSCI Parties") expressly disclaims all warranties (including, without limitation, any warranties of originality, accuracy, completeness, timeliness, non-infringement, merchantability and fitness for a particular purpose) with respect to this information. Without limiting any of the foregoing, in no event shall any MSCI Party have any liability for any direct, indirect, special, incidental, punitive, consequential (including, without limitation, lost profits) or any other damages. (www.msci.com) One cannot invest directly in an index. Index performance does not reflect the expenses associated with the management of an actual portfolio. Investing in any investment vehicle carries risk, including the possible loss of principal, and there can be no assurance that any investment strategy will provide positive performance over a period of time. The asset classes and/or investment strategies described in this publication may not be suitable for all investors. Investment decisions should be made based on the investor's specific financial needs and objectives, goals, time horizon, tax liability and risk tolerance.