Most years see some manner of substantial decline in stocks, even as most full-year tallies turn out positive. This year has proved an exception to that tendency. Thus far, at least—there’s still about a month to go. With stocks well off the trough for the year, but still far from their peak at the start of 2022, many are wondering what’s to come next. We’re not much for specific predictions, so readers will hear echoes of our broader investment approach in our thoughts for 2023:
- Macroeconomic volatility likely will remain elevated in 2023. Those forces in turn may promote instability in corporate earnings, so stock investors are likely to see price volatility remain heightened next year, too
- But stocks are naturally volatile. So more volatility should always be a core component of return expectations
- Per our normal stance, we expect longer-term stock returns to be positive, though perhaps not yet in 2023
- But let’s not forget that the market generally gets ahead of turns in macroeconomic growth and corporate fortune. So folks concerned about the news flow of late may find focusing only on the present may crimp the potential gains a longer-term perspective may provid
Listen to this month's Notes from the CIO podcast:
Podcast: Play in new window
Subscribe: Apple Podcasts | RSS
Not the Normal Outcome
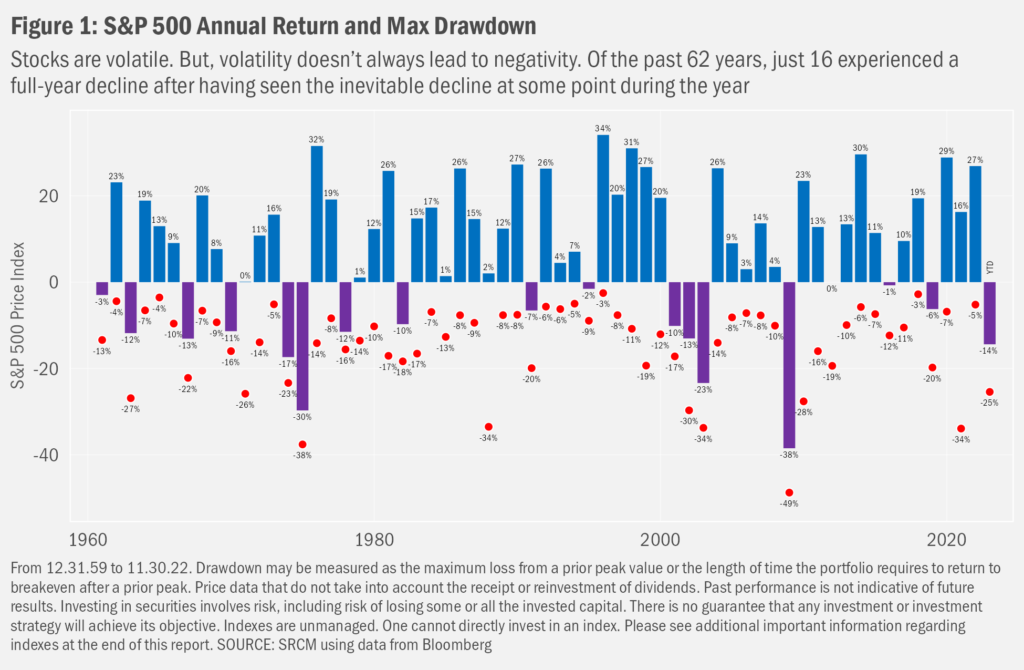
History shows that most years, U.S. stocks have seen positive returns. This year so far has bucked that norm. With only a month to go, seems quite possible we may not see the broader market turn positive by New Year’s Eve. Despite the nearly 14% rebound from October’s low, we’ve have heard more than a few folks suggesting the worst hasn’t yet been seen from this latest equity drawdown. That recession is nigh and stocks will plunge in sympathy at some point next year. Such pessimism seems always the easier note to strike when the market’s down and the rebound seems set upon a shaky foundation. But honest folks will admit they have no idea how next year’s market will perform and that whatever specific forecast they are offering must sit within a range of outcomes that include both better and worse scenarios. Of course, a wide range of potential outcomes is par for the course of equity returns, as our next chart demonstrates.
Wide Range of “Yearly” Returns
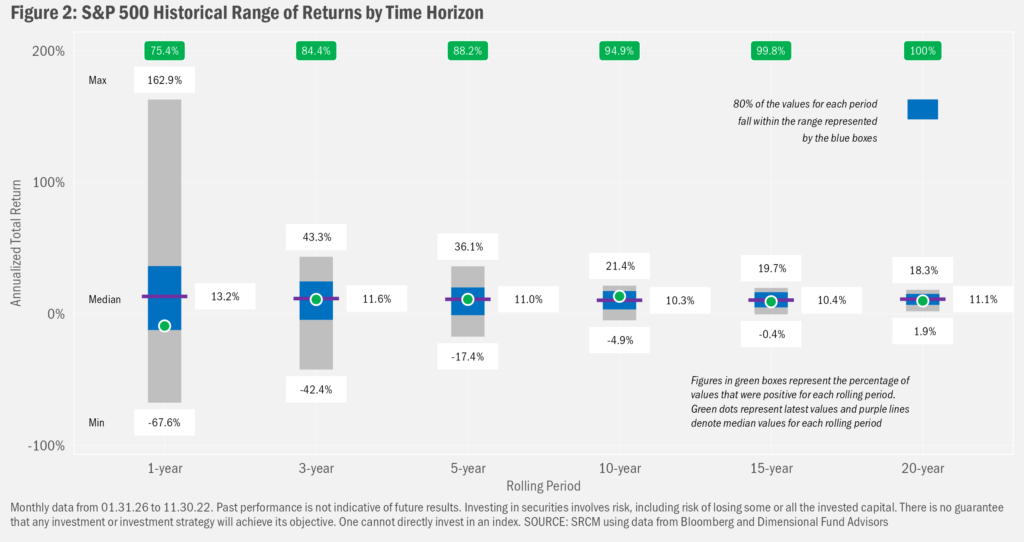
Looking at market returns only through the January-to-December lens masks the fact that stocks are pretty volatile over any 12-month period, including those that don’t begin in January. Starting from the beginning of 1926, there have been 1,152 12-month periods through the end of November 2022. The median return of the S&P 500 Index across those “rolling” periods was 13.2%. Well distant from the far more extreme drops seen in history, the S&P’s decline of 9.2% (including dividends) over the past 12 months (November 2021 through November 2022) sits well within the range of values that most results fall.
Positively Biased
And that range has a positive bent: more than three-quarters of rolling 1-year returns have been positive. Sequential down years are possible for sure, and the U.S. stock market has seen very long periods over which investors would have lost money, but the longer we look out into the future, the greater the propensity for returns to have been positive. Not all can maintain such patience in the face of market volatility, though. So will take the opportunity of the year’s close to remind readers to reach out to an advisor to discuss any shifts in comfort with exposure to market risk, as well as any changes in financial situations and goals.
Speaking of looking to the future, wishing everyone a safe a festive close to 2022 and a grand launch into the new year.
Important Information
Signature Resources Capital Management, LLC (SRCM) is a Registered Investment Advisor. Registration of an investment adviser does not imply any specific level of skill or training. The information contained herein has been prepared solely for informational purposes. It is not intended as and should not be used to provide investment advice and is not an offer to buy or sell any security or to participate in any trading strategy. Any decision to utilize the services described herein should be made after reviewing such definitive investment management agreement and SRCM’s Form ADV Part 2A and 2Bs and conducting such due diligence as the client deems necessary and consulting the client’s own legal, accounting and tax advisors in order to make an independent determination of the suitability and consequences of SRCM services. Any portfolio with SRCM involves significant risk, including a complete loss of capital. The applicable definitive investment management agreement and Form ADV Part 2 contains a more thorough discussion of risk and conflict, which should be carefully reviewed prior to making any investment decision. All data presented herein is unaudited, subject to revision by SRCM, and is provided solely as a guide to current expectations.
The opinions expressed herein are those of SRCM as of the date of writing and are subject to change. The material is based on SRCM proprietary research and analysis of global markets and investing. The information and/or analysis contained in this material have been compiled, or arrived at, from sources believed to be reliable; however, SRCM does not make any representation as to their accuracy or completeness and does not accept liability for any loss arising from the use hereof. Some internally generated information may be considered theoretical in nature and is subject to inherent limitations associated thereby. Any market exposures referenced may or may not be represented in portfolios of clients of SRCM or its affiliates, and do not represent all securities purchased, sold or recommended for client accounts. The reader should not assume that any investments in market exposures identified or described were or will be profitable. The information in this material may contain projections or other forward-looking statements regarding future events, targets or expectations, and are current as of the date indicated. There is no assurance that such events or targets will be achieved. Thus, potential outcomes may be significantly different. This material is not intended as and should not be used to provide investment advice and is not an offer to sell a security or a solicitation or an offer, or a recommendation, to buy a security. Investors should consult with an advisor to determine the appropriate investment vehicle.
The S&P 500 Index measures the performance of the large-cap segment of the U.S. equity market.
One cannot invest directly in an index. Index performance does not reflect the expenses associated with the management of an actual portfolio. Investing in any investment vehicle carries risk, including the possible loss of principal, and there can be no assurance that any investment strategy will provide positive performance over a period of time. The asset classes and/or investment strategies described in this publication may not be suitable for all investors. Investment decisions should be made based on the investor's specific financial needs and objectives, goals, time horizon, tax liability and risk tolerance.