This month five years ago, we provided a data-focused retrospective showing performance subsequent to investments in the domestic stock market at near-term peaks. At the time, we had just experienced a year like no other: each month in 2017 saw a market peak (including the effects of dividends) higher than that achieved the prior month end. So, the record year of month-on-month gains had a few folks worried we were in for a fall. As we suggested might prove the case in that piece, what happened next was not surprising:
- As a result of a dramatic December 2018 plunge, the 1-year return was negative from the final month of 2017
- But fresh peaks were achieved in 2018, 2019, 2020 (even with the COVID crash) and 2021
- After a poor showing in 2022 (leaving 1-year returns subsequent to much of 2021 in the red), we hit another peak close last December
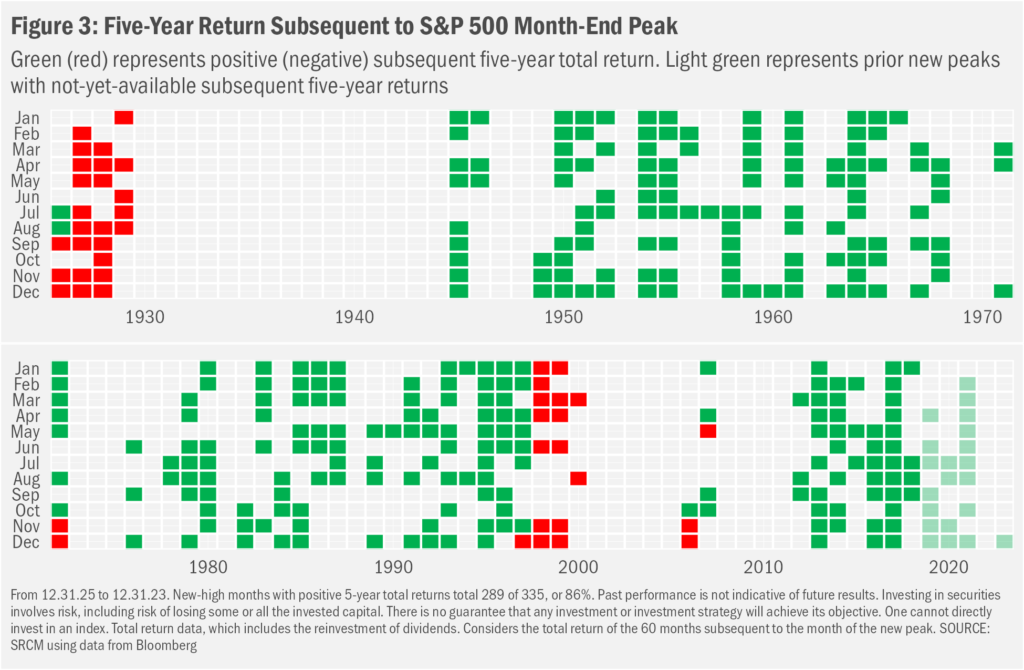
- Five-year returns were green for each of the 2017-18 peaks
- Turns out that patience with market volatility was once again rewarded with time, even when the starting point was at a market peak
Since We Last Spoke…
Trepidation in the face of market ebullience is understandable: why invest now when it seems the gains that might be had already have been had? That thinking, though, may be ignoring the fact that growth in stock prices is linked to growth in earnings; to the extent that the latter continues to rise, the former may, too. That said, earnings tend to fall during recessions, so macroeconomic slowdowns historically have tended to result in pauses, sometimes lengthy, in the market’s march higher. But recession-related declines have tended to present their own going-forward opportunities for outsized longer-term gains. And that’s the cause for drama: does one invest now or wait for the pullback? As subsequent charts will demonstrate, one tends to be rewarded either way in the fullness of time. Regular savers, therefore, might like to keep investing regardless the level of the market. And even those not periodically socking away fresh funds should find comfort in the tendency for stocks to rise over time, even as short-term moves may be negative.
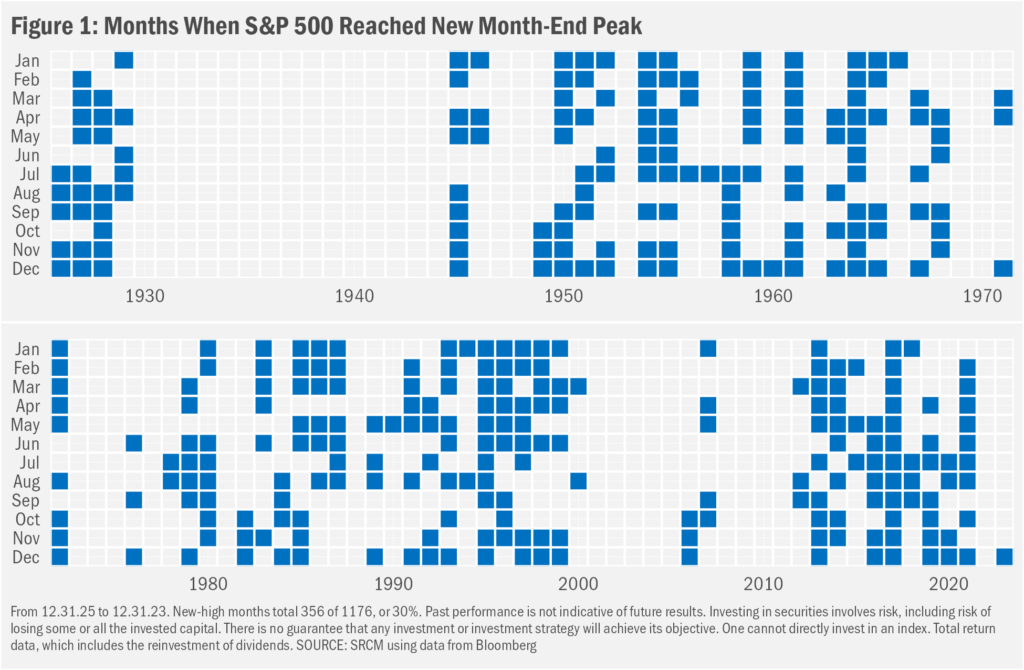
…What Happened Next?
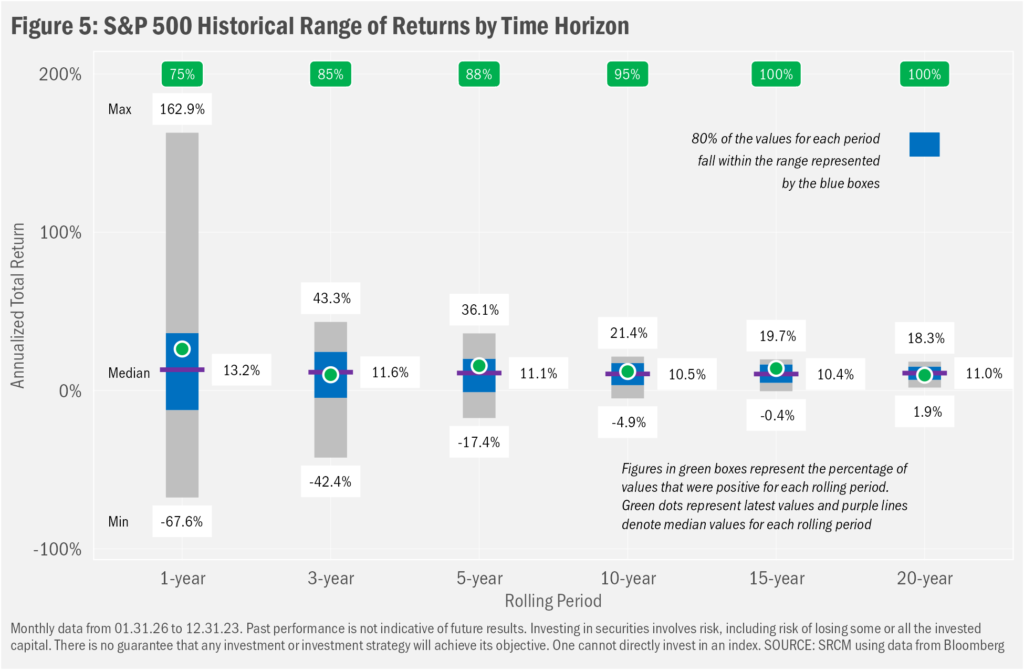
As we have stated so often on these pages in the past, at least since the early 20th century market returns have tended toward more positive outcomes as the length of the holding period increased. But gains were not and are not guaranteed. So, we generally seek to align investor exposure to the market with their probable comfort with the drawdowns they may experience over time. That exposure is meant to be relatively consistent, as we know that timing when to be in the market is impossible. Core to our investment strategy, then, is the notion that it seems always a good time to be in the market, but only up to the level of exposure that presents potential negative outcomes that fall within an acceptable zone. To achieve that balance, we seek to match the time horizon of each investment portfolio to an applicable historical range of outcomes. We then meter equity exposure to a level that each investor believes to be a max-comfort drawdown while also considering each client’s capacity to whether market declines from a liquidity needs standpoint.
As we noted earlier, though, even seasoned investors may find maintaining equity exposure at market peaks somewhat discomforting. Depending on the investment time horizon, historical data suggest that need not be the case. For example, we can look back to early 2018 when investors feared the gains seen in 2017 had come too regularly and too quickly. Those fears eventually proved partially grounded. The 12 vertical squares above 2017 in Figure 2 are all green except for the December one, meaning that the market was down one year after 12.31.17 after having seen a positive 1-year return for every other month in 2018. So, too, for the 1-year return after the monthly market peak set on 01.31.18. That’s because the market wobbled early on in 2018, then rose strongly into late September only to see a near 20% decline through Christmas eve that year. It took the market until April the next year to fully recover.
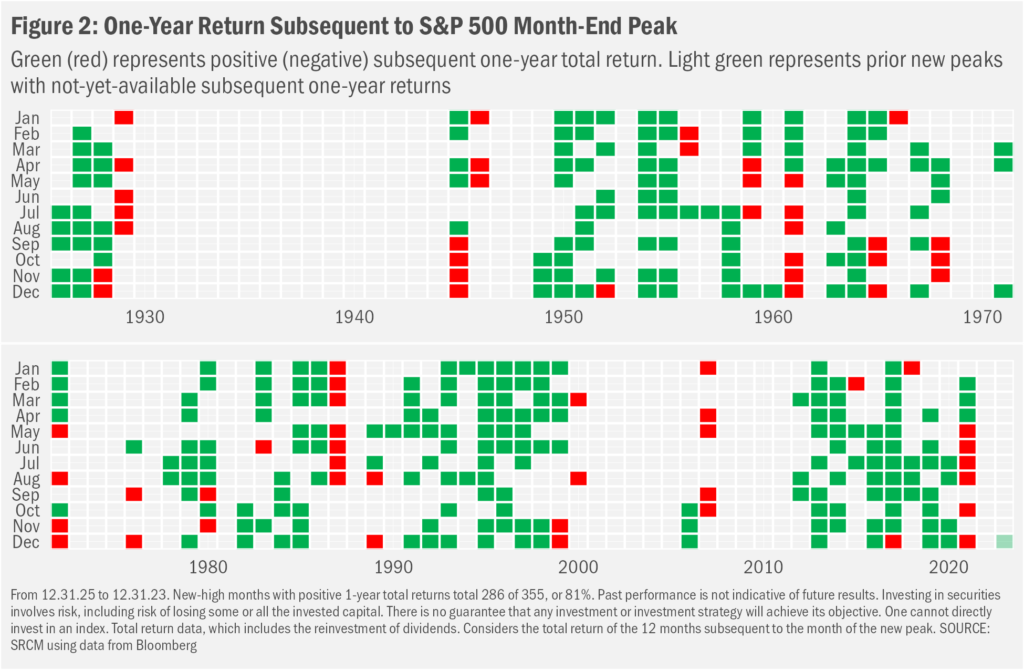
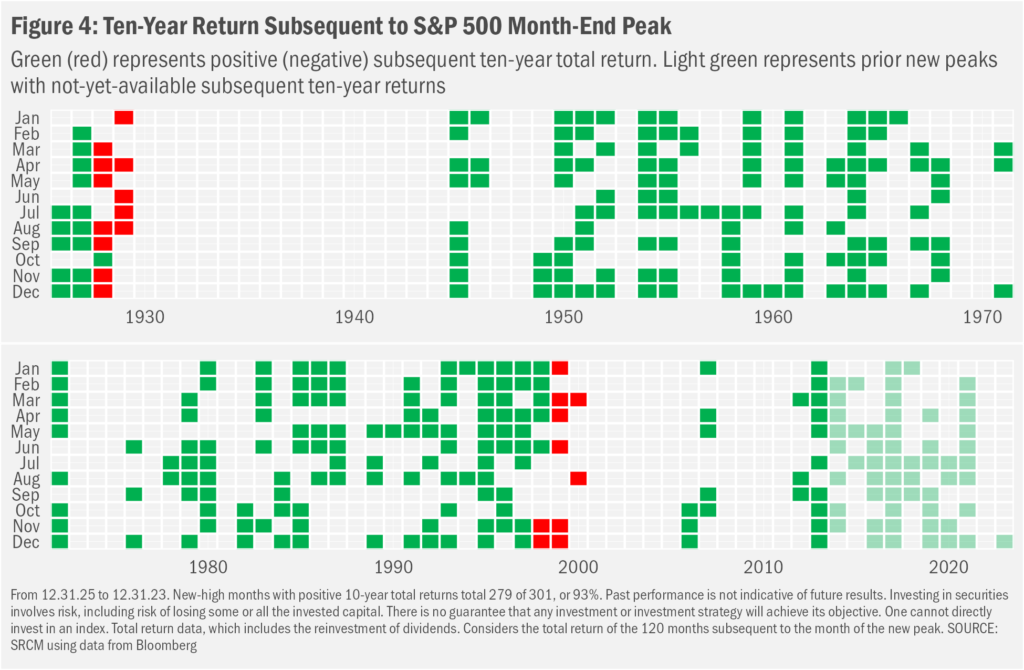
Those two negative outcomes fall in the fifth of historical post-peak years that saw stocks fall. Flipping that ratio around, the market otherwise was higher 81% of the time a year after having set a new month-end peak. And as we look further into the future, the likelihood of gains has tended to increase. Over the 5- and 10-years periods subsequent to month-end peaks the market has been higher 86% and 93% of the time, respectively (see Figures 3 and 4). And such has been the case since those then seemingly heady days of 2017.
Important Information
Signature Resources Capital Management, LLC (SRCM) is a Registered Investment Advisor. Registration of an investment adviser does not imply any specific level of skill or training. The information contained herein has been prepared solely for informational purposes. It is not intended as and should not be used to provide investment advice and is not an offer to buy or sell any security or to participate in any trading strategy. Any decision to utilize the services described herein should be made after reviewing such definitive investment management agreement and SRCM’s Form ADV Part 2A and 2Bs and conducting such due diligence as the client deems necessary and consulting the client’s own legal, accounting and tax advisors in order to make an independent determination of the suitability and consequences of SRCM services. Any portfolio with SRCM involves significant risk, including a complete loss of capital. The applicable definitive investment management agreement and Form ADV Part 2 contains a more thorough discussion of risk and conflict, which should be carefully reviewed prior to making any investment decision. All data presented herein is unaudited, subject to revision by SRCM, and is provided solely as a guide to current expectations.
The S&P 500 Index measures the performance of the large-cap segment of the U.S. equity market.
The opinions expressed herein are those of SRCM as of the date of writing and are subject to change. The material is based on SRCM proprietary research and analysis of global markets and investing. The information and/or analysis contained in this material have been compiled, or arrived at, from sources believed to be reliable; however, SRCM does not make any representation as to their accuracy or completeness and does not accept liability for any loss arising from the use hereof. Some internally generated information may be considered theoretical in nature and is subject to inherent limitations associated thereby. Any market exposures referenced may or may not be represented in portfolios of clients of SRCM or its affiliates, and do not represent all securities purchased, sold or recommended for client accounts. The reader should not assume that any investments in market exposures identified or described were or will be profitable. The information in this material may contain projections or other forward-looking statements regarding future events, targets or expectations, and are current as of the date indicated. There is no assurance that such events or targets will be achieved. Thus, potential outcomes may be significantly different. This material is not intended as and should not be used to provide investment advice and is not an offer to sell a security or a solicitation or an offer, or a recommendation, to buy a security. Investors should consult with an advisor to determine the appropriate investment vehicle.
