Our experience during the various boom-bust cycles of this millennium suggests themes built upon the sandy ground of indefensible valuations eventually erode. Relative gains may come, then, from having more heavily emphasized those stocks with sounder footings. Here again, the current environment presents value-minded U.S. equity market investors with a conundrum:
- With the everything-GenAI trade still seeming to dominate investor interest, more folks seem to be rethinking their approaches to investment management…that this time might actually be different
- We’ve seen few data that suggest this time is any different
- So, while we might maintain exposure to generative artificial intelligence theme across our portfolios, we tend to continue to emphasize those stocks that have not become so grand and expensive as those marquee names
- While much of the global equity market may be found as relatively expensive by some metric, data suggest there remain pockets of relative value both here and abroad
Compared to…?
It’s become rather boring to suggest that the U.S. equity market is expensive. The statement also requires a reference point. Versus what? Last month we provided some evidence using a “versus itself” approach that compared the present ratio of the price level of the S&P 500 Index to the trailing average real earnings of the index’s members. We also floated a “versus other stocks” comparison in the same view, showing that, while they, too, are relatively expensive versus themselves, European stocks have not seen the same valuation expansion as have U.S. stocks. This month, we’ll expand on those observations. The first view, in Figure 1, demonstrates that valuations are widely dissimilar even across U.S. stocks when grouped by size (market capitalization).

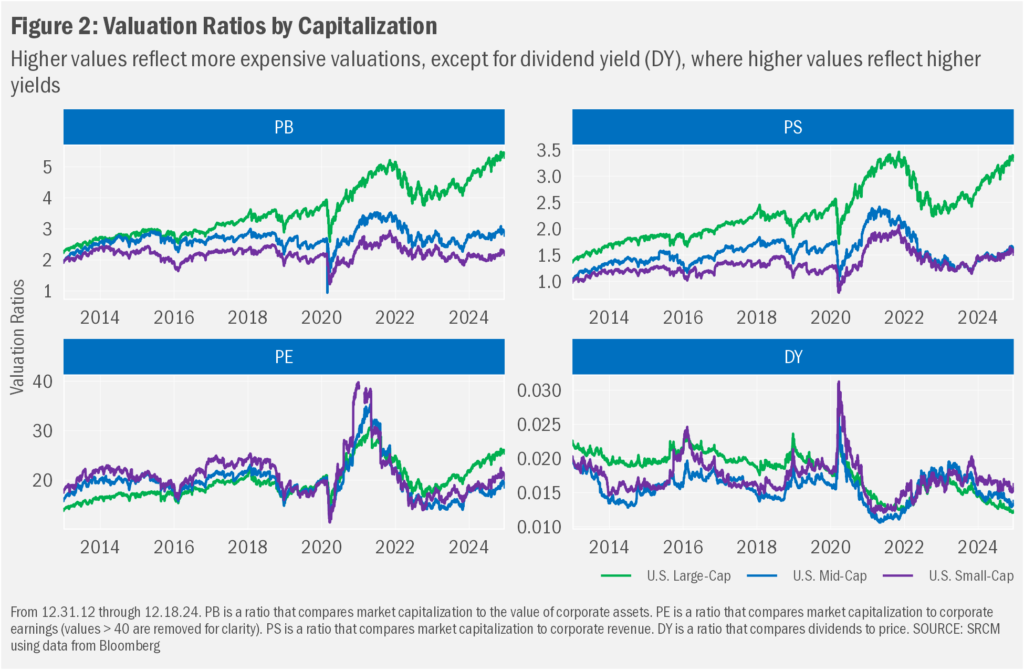
As large-cap valuations have soared, mid- and small-cap valuations have trended lower on a relative basis. This even as absolute values across all U.S. stocks have trended higher (as seen in Figure 2, where we show several valuation metrics). This is not solely a U.S. phenomenon. Figure 1 also shows that domestic large-cap stock valuations have steadily expanded above those of non-U.S. stocks.

Richly Rich
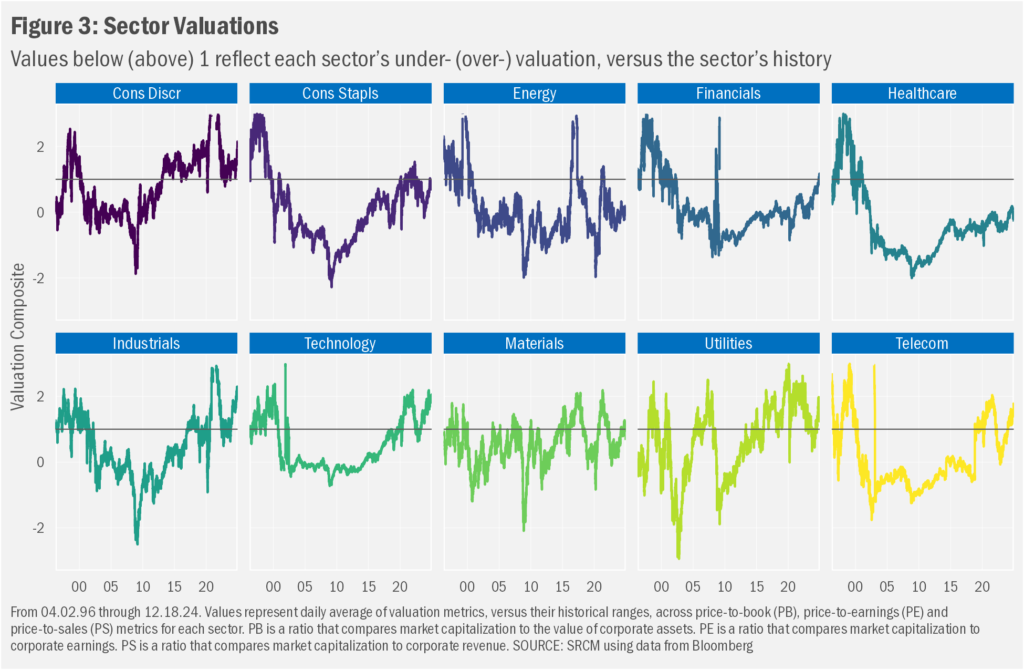
The trend also is not solely due to the valuation expansion among many of the Magnificent 7, as valuations are reasonably rich across much the U.S. stock landscape when viewed through a sector-level lens. In Figure 3 we show sector-level valuations over time, comparing each point in time with the entire history of data. Higher values reflect a then-current valuation on the more expensive end of the sector’s history (using just under three decades of available data).
Challenging the sector comparisons we show in Figure 3 are the various interpretations one must make of the data (when is that not the case with financial data though!). For example, one can look at the Technology sector and suggest that it’s not really all that overvalued in the context of its history. But its history (for the purposes of this analysis) includes the Technology Bubble of 2000-2001. Eliminate those years from the data set and one sees a rather steady march upward in valuations from 2015 onward. Now, we can show relative earnings growth data that may be said to support those gains in valuations (and those of the broader U.S. market, too). Still, one must wonder how long such extraordinary growth might continue. One need not wonder, though, what impact a reduction in that growth might have on the stocks within that sector.
And it’s not just the Technology sector that gives us means for caution. The Consumer Discretionary sector (purveyors of stuff we as consumers buy but don’t really need) also seems rather valuation-rich compared to its history. The primary culprits there are two of the Magnificent 7 names: Amazon Inc. (AMZN) and Tesla (TSLA), which together comprise more than 40% of the sector’s market cap. At least by way of this review, Figure 3 suggests we should read few individual sectors as inexpensive at present.
So, should these perspectives limit our enthusiasm for investing in U.S. stocks? We think the answer to that question is a qualified no. On the “warranting caution” side, it’s a feature of market history that higher starting valuations tend to result in lower longer-term returns (see Figure 2 in last month’s commentary for details). Note, though, that those references are on a relative basis, meaning while we might expect future returns to be lower than the rather astounding gains we’ve experienced over the past few years, we might not need to expect them to be negative. The theory behind that thinking relates to the fact that we should consider each stock to be “worth” its future earnings potential. Estimates for that potential range widely for most stocks. The aggregate of those expectations can be read through stock valuations such as those we’ve shown in our figures this month. The higher the present valuation, the greater the expectation for future earnings and the greater the proportion of those future earnings that already is reflected in the stock price.
Growth, Growth Everywhere?
But if everything is expensive, then aren’t all stocks growth stocks? In short…no. “Expensive” is a relative concept with no absolute reference point. While we can conjure up a range of analytics that compare past, present and “future” valuations against various reference points, with an over/under view determining relative valuation, we cannot properly suggest that any specific absolute valuation level is the correct one. So even in a world where all stocks are more expensive than they ever have been, there almost certainly will remain stocks that are more or less richly valued than the others. Therefore, on the “warranting optimism” side, there remain a wealth of reasons to maintain exposure to U.S. stocks at a level commensurate to comfort with equity risk.

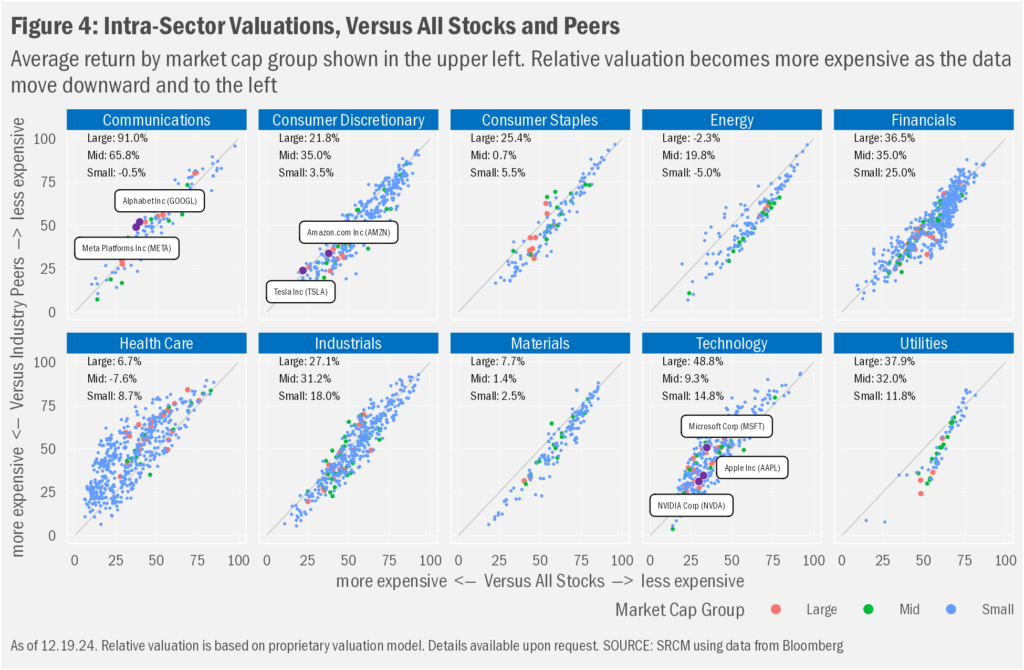
Which brings us to another informative view of the nature of stock valuation. In Figure 4 we show a chart similar to that we presented last month showing the composite valuation of the Magnificent 7 stocks against all stocks and their industry peers. The following chart takes those data (updated for changes since we posted our commentary last month) and collates the stocks into their respective industries. Like the figure last month, this view shows that in every sector, there are stocks that can be seen as less expensive than their peers. We added an additional data layer to show that, while it’s true that U.S. large-cap stocks generally have trounced mid- and small-cap names this year, that’s not necessarily true for all sectors, as that feature of 2024 performance mostly can be ascribed to the performance of a few members of the Magnificent 7, the hefts of which pulled up the group weighted average. Under this methodology, then, in virtually any market we are likely to encounter, we will find stocks that can be measured as more attractive from a valuation standpoint than others. And that means we may be able to construct portfolios that emphasize those undervalued stocks. And we can apply that thinking to other factors (e.g., relative size and relative profitability) to construct portfolios that emphasize those characteristics, too.

Factor Features
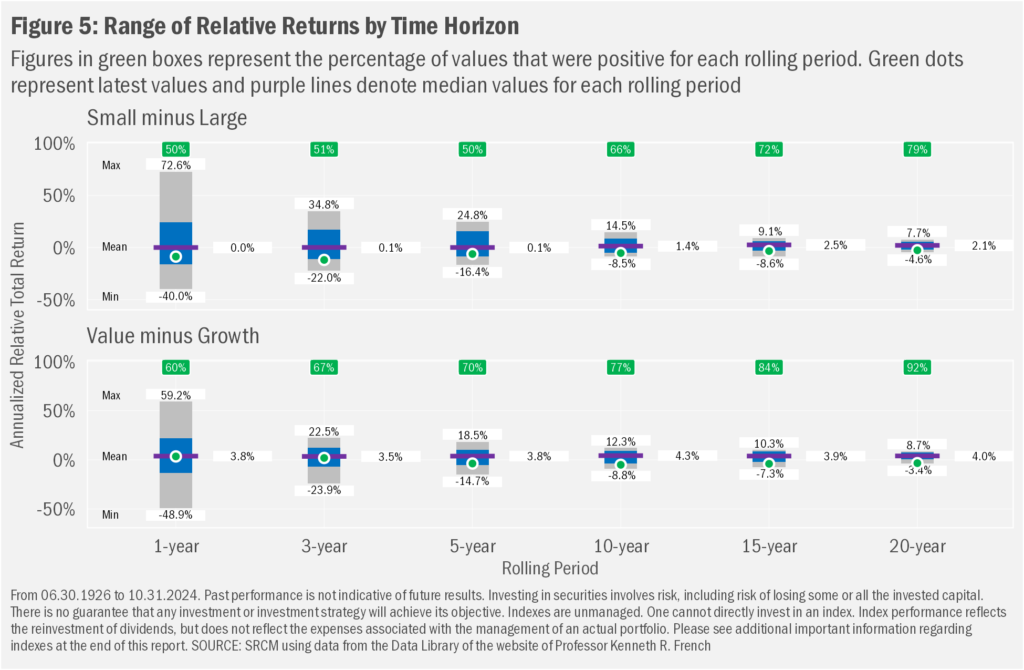
Why those emphases? In Figure 5 we show the range of outcomes of the two core factors that inform the stock overweights within most of our portfolios: relative valuation and relative size. The chart shows “rolling period” returns over a range of time frames. Starting with the first data point, a rolling period takes each increment of data and looks forward to calculate that period’s returns. In this case, we are using monthly data. So, to calculate a 1-year return we combines the returns over 12-month time frames. For a 5-year return, we calculate the return over 60 consecutive months, in turn “annualizing” that return to arrive at a geometric average return (the theoretical return one would have seen over each consecutive year when considering the compounding effects of returns over the entire period). Then we step forward one month and calculate the returns again. We then average those returns for each rolling period.
In the chart, we calculate rolling returns for small-cap and large-cap stocks, in addition to those for value and growth stocks. We then subtract the latter from the former for each group (small-minus-large and value-minus-growth) to arrive at the relative returns. Charted are those differences. Note that in each case, the longer the time frame, the more likely one would have been to have seen a positive relative performance from our favored factors (small beats large or value beats growth).

Crude Comparisons
Being totally honest, our collective decades in the investment management business have proved to us that valuation constructs offer means only for crude comparisons at the stock level. That’s why we have chosen to build portfolios that allow for valuation (and size and relative profitability) to inform single-stock weights in the portfolio relative to their weights in the benchmark index. The more attractive a stock is from these “factor” perspectives, the likely more aggressive the portfolio’s overweight to that stock, versus its weight in the index. So, while we might be underweighting bigger, growthier (from a valuation standpoint, at least) stocks, we are likely to still own them in the portfolio. This approach, we believe, should allow our portfolios to potentially benefit from the historically more attractive performance that smaller and less richly valued names have experienced, while not leaving the portfolio solely exposed to those periods of time—much like the present—when markets seem to have ignored that history and the lessons is offers.
Important Information
Statera Asset Management is a dba of Signature Resources Capital Management, LLC (SRCM), which is a Registered Investment Advisor. Registration of an investment adviser does not imply any specific level of skill or training. The information contained herein has been prepared solely for informational purposes and is not an offer to buy or sell any security or to participate in any trading strategy. Any decision to utilize the services described herein should be made after reviewing such definitive investment management agreement and SRCM’s Form ADV Part 2A and 2Bs and conducting such due diligence as the client deems necessary and consulting the client’s own legal, accounting and tax advisors in order to make an independent determination of the suitability and consequences of SRCM services. Any portfolio with SRCM involves significant risk, including a complete loss of capital. The applicable definitive investment management agreement and Form ADV Part 2 contains a more thorough discussion of risk and conflict, which should be carefully reviewed prior to making any investment decision. Please contact your investment adviser representative to obtain a copy of Form ADV Part 2. All data presented herein is unaudited, subject to revision by SRCM, and is provided solely as a guide to current expectations.
U.S. Large-Cap Stocks: Based on the Bloomberg U.S. Large Cap Total Return Index, a float market-cap-weighted benchmark of the 500 most highly capitalized U.S. companies. U.S. Mid-Cap Stocks: Based on the Bloomberg U.S. Mid Cap Total Return Index, a float market-cap-weighted benchmark of those securities in the Bloomberg U.S. 3000 Index with a market capitalization ranking between 501 and 900. U.S. Small-Cap Stocks: Based on the Bloomberg U.S. 600 Total Return Index, a float market-cap-weighted benchmark of the lower 600 in capitalization of the Bloomberg U.S. 1500 Index. The Bloomberg U.S. 1500 Total Return Index is a float market-cap-weighted benchmark of the 1,500 most highly capitalized U.S. companies. The Bloomberg U.S. 3000 Total Return Index is a float market-cap-weighted benchmark of the 3,000 most highly capitalized U.S. companies. Developed Stocks: Based on the Bloomberg Developed Markets ex U.S. Large & Mid Cap Net Return Index is a float market-cap-weighted equity benchmark that covers the top 85% of market cap of the measured market. Emerging Stocks: Based on the Bloomberg Emerging Markets Large & Mid Cap Net Return Index is a float market-cap-weighted equity benchmark that covers the top 85% of market cap of the measured market.
Value and Growth Stocks: Based on Fama/French U.S. Book-to-Market Research Indexes: Provided by Professors Eugene Fama and Kenneth French. Index constituents are formed on book equity (BE) / market equity (ME) at the end of each June using NYSE breakpoints. The BE used in June of year t is the book equity for the last fiscal year end in t-1. ME is price times shares outstanding at the end of December of t-1. The reconstitution considers all NYSE, AMEX, and NASDAQ stocks for which we have ME for December of t-1 and June of t, and BE for t-1. The Fama/French U.S. Value Research Index includes the lower 30% in price-to-book. The Fama/French U.S. Growth Research Index includes the higher 30% in price-to-book.
Small and Large Stocks (Figure 5 only): Based on Fama/French U.S. Size Research Indexes: Provided by Professors Eugene Fama and Kenneth French. Index constituents are formed at the end of each June using June market equity and NYSE breakpoints. The reconstitution considers for July of year t to June of t+1 include all NYSE, AMEX, and NASDAQ stocks for which are available market equity data for June of t. The Fama/French U.S. Small Research Index includes the lower 30% in market capitalization. The Fama/French U.S. Large Research Index includes the higher 30% in market capitalization.
The opinions expressed herein are those of SRCM as of the date of writing and are subject to change. The material is based on SRCM proprietary research and analysis of global markets and investing. The information and/or analysis contained in this material have been compiled, or arrived at, from sources believed to be reliable; however, SRCM does not make any representation as to their accuracy or completeness and does not accept liability for any loss arising from the use hereof. Some internally generated information may be considered theoretical in nature and is subject to inherent limitations associated thereby. Any market exposures referenced may or may not be represented in portfolios of clients of SRCM or its affiliates, and do not represent all securities purchased, sold or recommended for client accounts. The reader should not assume that any investments in market exposures identified or described were or will be profitable. The information in this material may contain projections or other forward-looking statements regarding future events, targets or expectations, and are current as of the date indicated. There is no assurance that such events or targets will be achieved. Thus, potential outcomes may be significantly different. This material is not intended as and should not be used to provide investment advice and is not an offer to sell a security or a solicitation or an offer, or a recommendation, to buy a security. Investors should consult with an advisor to determine the appropriate investment vehicle.
