It’s sometimes (often lately?) a challenge to support the idea that history suggests investors should be more interested in owning a wide swath of companies about which barely anyone knows anything. These companies, generally smaller and definitionally less glamorous than their higher-notoriety cousins, are real companies with real businesses that have inherent values. Investors have tended to see cycles over which the collective value of smaller companies shifts from ignored to realized. While we believe we remain a fair distance away from “full” realization of the value in smaller-cap stocks (in particular the less expensive shares among them), recent market activity suggests investors:
- are becoming more cognizant of the extraordinary demands on future growth present valuations require of large-cap technology stocks
- can quickly shift dollars from one bucket to another. Where there is a mismatch in liquidity (e.g., a half-trillion dollars from a few big stocks spread across many hundreds of stocks with far less daily interest), the impact on heretofore overlooked shares can be substantial
- should remain mindful that, as the last few days of performance reveal, quick shifts can occur in both directions
All Caught Up
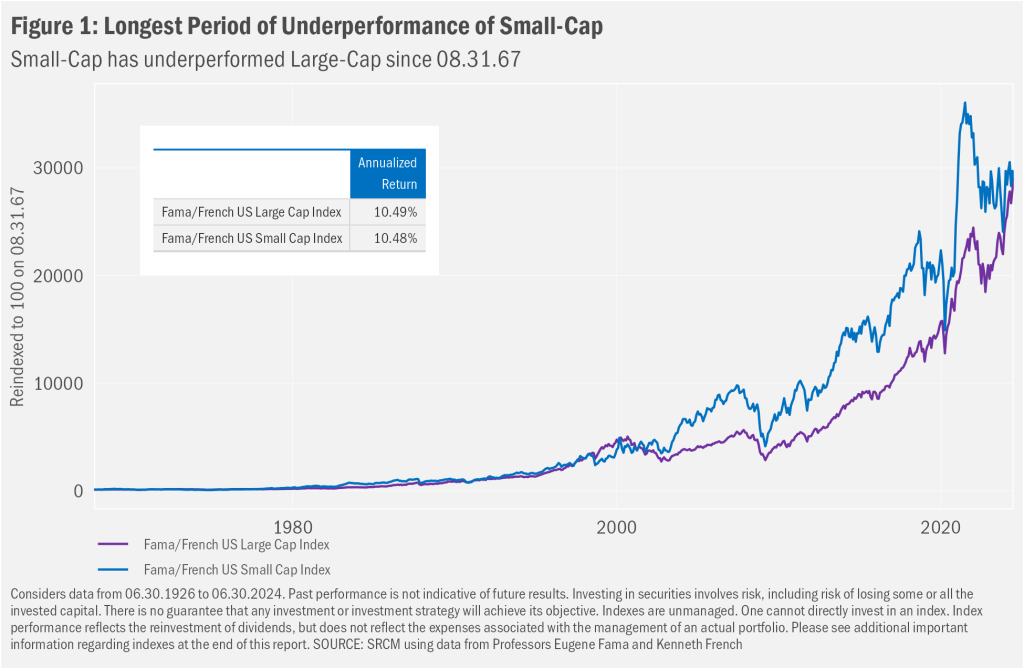
Over the past year or so, purveyors of the means to develop generative AI—chipmakers, mainly, with Nvidia Corporation (NVDA) the marquee name—have seen gains in their shares soar well above that of the average stock. With the largest of large stocks leading the charge being core to the AI story (see our December 2023 commentary for a bit dated but still relevant overview), the AI frenzy has left most smaller stocks in the dust, dramatically narrowing the lead small-cap stocks have gained versus large caps over the past century. To wit, Figure 1 looks backwards for the longest date since which small caps have underperformed and shows smaller stocks have underperformed for 57 years. In fact, this most recent bout of long-term underperformance is at a record, which we detail in Figure 2.
Risk in the Premium
But both figures visually overstate large-cap outperformance and obscure the generally cyclical nature of the relative performance of small-cap stocks. In Figure 2 we can see that the underperformance tends to rise over a long period, then collapse. Those drops reflect medium-term outperformance of small caps. And in Figure 3, we present two views of this cyclicality. In the top chart we show the trailing relative returns (again, small cap return minus large-cap return) each month over a range of periods (1 year, 5, year, etc.). Note that the relative return wavers over time across a wide range of outcomes. The second chart displays these ranges for each period. While the latest values (green dots) fall well into the “much worse than large caps” side of relative outcomes, none is the worst ever experienced since World War II. Further, we can see in the average results for each period (green squares at the top) that, as the length of the period grows, so does the propensity for small-cap shares to have outperformed. Here, again, when it comes to the potential for realization of investment risk premiums, patience has tended to have found greater reward.

Rotation or Blip
Figure 3 also highlights the tendency for shifts in small-cap performance to come quickly and strongly, much as we saw in July. While such substantial relative gains were never a given (and as we write this commentary, a good portion of the relative gain has been erased), they do not surprise us a bit. Mega-cap technology stocks have soared over the past few years on account of an implicit belief that future fundamental gains (revenue and earnings) will at least match and in many cases exceed those seen in the near term. And by that we mean these stocks have broadly become much more expensive as share gains generally have far outpaced revenue/earnings growth from generative AI investments.
As we move further into Q3 earnings season, most large-cap tech names have reported, and it turns out that investor enthusiasm for the generative AI theme may, minimally, have been premature. With the exception of Meta Platforms (META), investor responses to Q3 mega-tech earnings reports have ranged from lackluster to punitive. Conversely to the recent past, share pressures have grown despite the fact that most companies have suggested expenditure on AI-related gear will remain high. For context, the Financial Times tallied capital expenditures for the Magnificent 7 [Amazon (AMZN), Microsoft (MSFT), Alphabet (GOOG/GOOGL), Meta, Apple (AAPL), Tesla (TSLA) and Nvidia] in their latest fiscal years and arrived at a total of $177 billion. That amounts to 18% of capex aggregate for all companies in the S&P 500 Index. Ten years ago, their collective spending comprised just 5% of the sum for S&P 500 Index members. Meantime, the FT says the Mag7’s share of research and development expenditures of $242 billion are now 40% of the S&P’s total, versus about 15% a decade ago. Both metrics are set to rise in absolute terms and proportionately this year.
Or at least they were. For some time now, investors seem to have been blindly applauding such aggressive spending. Even more, investors seem to have been more than happy to be blissfully unchallenging of or otherwise play make-believe when it comes to the potential profitable applications of current (and likely medium-term iterations) of generative AI technologies. Gains in the shares of companies core and tangent to the space have rewarded the lack of scrutiny. As we so often state, though, shifts in investor sentiment can come quickly, sometimes without an obvious trigger. We may have reached such a turn in sentiment regarding the generative AI and all the swooning it has induced.
Perhaps investors are beginning to focus first on the potential payback for all the investment. Tellingly, more than a few of the conversations we’ve read regarding this intense spending have suggested AI capital budgets remain so lofty primarily to ensure these companies are not left behind in the race to uncover the potential for AI technologies. Implicit in that notion is the thought that we have yet to identify the potential source(s) of returns-to-investment in AI, let alone the levels of those potential returns and, as crucially, when we might begin to see generative AI-related businesses defensibly support the arguably excessive valuations embedded in a handful of large-cap tech stock prices.
History demonstrates such aggressive biases regarding future potential growth generally prove unfounded (and may be particularly true in the case of generative AI). Very recent stock performance suggests that realization may be dawning on some investors. Meantime, as investors continue to question the still highly uncertain future of generative AI technologies and applications, we might expect them to begin shifting monies to less-loved portions of the market. As July’s action suggests, it might not take much in terms of increment interest to boost the stocks of small-cap firms, in particular those that lie on the less-expensive side of the valuation spectrum.
It's Also the Economy, Stoopid!
On the other hand, we learned today that not since Black Monday in 1987 has the Russell 2000 Index, a widely followed gauge of U.S. small-cap stock performance, turned in three days in a row of declines of 3% or more. Cyclical, indeed. Inclusive of the small-cap plunge, broader early-August market action conveys rather indiscriminate stock selling and bond buying. The trigger for the last two days’ drops was a weaker-than-expected unemployment rate of 4.3% for July that came in above expectations of 4.1% and hastened a deteriorating trend. That “second derivative” effect left investors on edge and the narrative shifted to a Fed that’s once again behind the curve.
Looked at in a different way (as one must with macro data), the increase in the unemployment rate over the last few months has come primarily from re-entrants into the workforce and temporary layoffs (with sour weather in July a meaningful factor). That folks have found the broader economy inviting enough to go out and look for work could be read as a positive sign. Meantime, the aggregate of macro data suggests an economy that may be weakening somewhat, but that remains on solid footing. Third-quarters earnings have been, on balance, reasonably positive as well. Inflation continues to abate (albeit at a somewhat uncomfortably slowing pace of decline). In the aggregate, trends at their current paces remain not so worrisome.
When it comes to recessions, though, what seems always to have mattered most is the trigger for a more rapid deterioration in macroeconomic results and prospects. Sadly, we cannot know what such a trigger will be in advance. But investors can always guess, and as they do, markets may move ahead of the data. As we move closer to the Fed’s first rate cut this cycle, we would expect further volatility around incoming macroeconomic reports. As always, please be sure to reach out to your advisor with any questions you may have in regard to the present positioning of your portfolio(s).
Important Information
Signature Resources Capital Management, LLC (SRCM) is a Registered Investment Advisor. Registration of an investment adviser does not imply any specific level of skill or training. The information contained herein has been prepared solely for informational purposes. It is not intended as and should not be used to provide investment advice and is not an offer to buy or sell any security or to participate in any trading strategy. Any decision to utilize the services described herein should be made after reviewing such definitive investment management agreement and SRCM’s Form ADV Part 2A and 2Bs and conducting such due diligence as the client deems necessary and consulting the client’s own legal, accounting and tax advisors in order to make an independent determination of the suitability and consequences of SRCM services. Any portfolio with SRCM involves significant risk, including a complete loss of capital. The applicable definitive investment management agreement and Form ADV Part 2 contains a more thorough discussion of risk and conflict, which should be carefully reviewed prior to making any investment decision. All data presented herein is unaudited, subject to revision by SRCM, and is provided solely as a guide to current expectations.
The S&P 500 Index measures the performance of the large-cap segment of the U.S. equity market.
Regarding references to “Small” and “Large” indexes in this report: Data provided by Professors Eugene Fama and Kenneth French. Index constituents are formed at the end of each June using June market equity and NYSE breakpoints. The reconstitution considers for July of year t to June of t+1 include all NYSE, AMEX, and NASDAQ stocks for which are available market equity data for June of t. The Fama/French U.S. Small Cap Index (a name assigned by SRCM to this group) includes the lower 30% in market capitalization. The Fama/French U.S. Large Cap Index (a name assigned by SRCM to this group) includes the higher 30% in market capitalization. The opinions expressed herein are those of SRCM as of the date of writing and are subject to change. The material is based on SRCM proprietary research and analysis of global markets and investing. The information and/or analysis contained in this material have been compiled, or arrived at, from sources believed to be reliable; however, SRCM does not make any representation as to their accuracy or completeness and does not accept liability for any loss arising from the use hereof. Some internally generated information may be considered theoretical in nature and is subject to inherent limitations associated thereby. Any market exposures referenced may or may not be represented in portfolios of clients of SRCM or its affiliates, and do not represent all securities purchased, sold or recommended for client accounts. The reader should not assume that any investments in market exposures identified or described were or will be profitable. The information in this material may contain projections or other forward-looking statements regarding future events, targets or expectations, and are current as of the date indicated. There is no assurance that such events or targets will be achieved. Thus, potential outcomes may be significantly different. This material is not intended as and should not be used to provide investment advice and is not an offer to sell a security or a solicitation or an offer, or a recommendation, to buy a security. Investors should consult with an advisor to determine the appropriate investment vehicle.