Though still relatively narrow in terms of the breadth of contributing stocks, the ongoing recovery from the 2021-22 bear market remains historically short and shallow. Past performance may tell us little in particular about the market’s future. But the historical context may offer fair reasons to maintain an otherwise risk tolerance-appropriate market exposure, despite the fact that this rally has extended well above the prior market peak:
- Relative to all drawdowns of 20% or more since the end of World War II, the latest (01.04.22 through 10.12.22) was on the milder side of the spectrum, at 25.4%
- So, too, has been the 510-day run since the 10.12.22 trough, coming in at 42% so far, compared to an average of 171% gain for post-WWII bull markets that, on average, have lasted about 5 years
- Of course, that history tells us nothing about how long this bull market might run. But it does offer the reminder that bull markets tend to have been more generous and generally longer-lived
- Better, we think, always to keep in mind the historical range of market outcomes over time and adjust portfolio exposures according to investor comfort than to decide when to invest based on rather arbitrary market levels
Up. Up and…
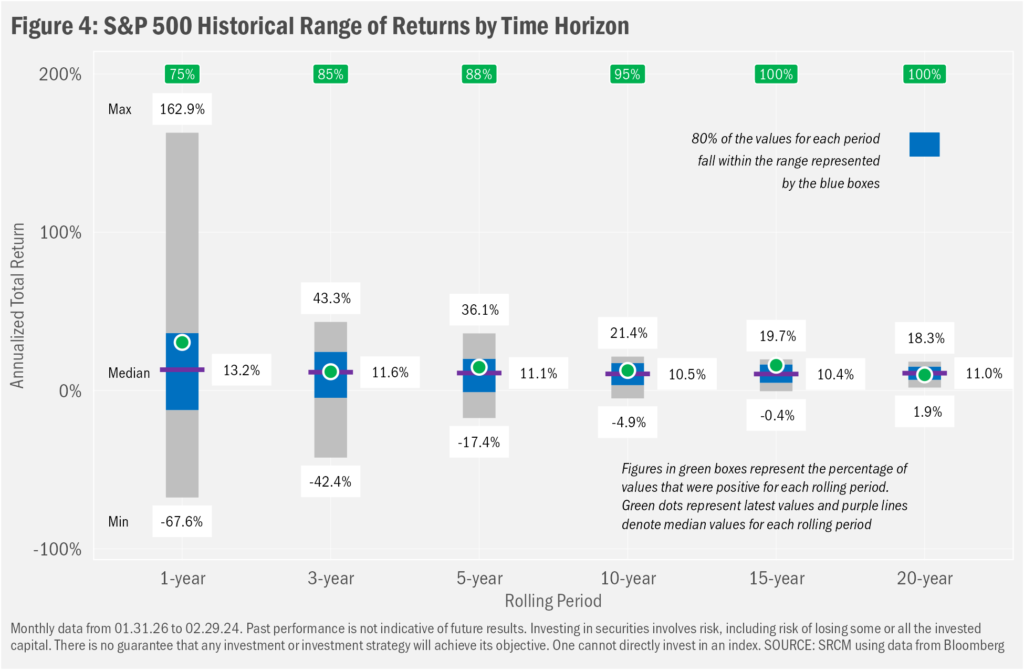
In January, we showed that investors saw gains 81% percent of the time a year after the S&P 500 hit a new month-end peak. “Yeah, but…the one-year return from the New Year’s 2022 peak was negative!” True. And the S&P 500 nearly turned in a loss for the ensuing two-year period as well. But those details serve as reminders that markets are volatile and often require time to produce gains. Speaking of time and gains, the U.S. stock market sits just a tick or two below all-time highs, having rebounded rather robustly from an interim drawdown in Q323 that followed a halting rise from the bear-market bottom of October 12, 2022. We’ve since heard lots of marveling at the pace of the gains along with sure statements that we’re due for a pullback. Such pronouncements are at the same time partly true and not so. Eyeing on the word “due”, there’s an accuracy in acknowledging the fact that markets are short-term volatile (the range of 1-year outcomes spans -68% to 163%). But it’s inaccurate to suggest that the market should fall just because it’s gone up.
…Up More?
Either way, the word “due” is a poor choice as it confers a sense of immediate inevitability based on the recent past, rather than a general inevitability that stems from the inherent natural tendencies of the market. There exists no law of market gravity that strengthens the further aloft the market flies. As we have stated so often on these pages in the past, market returns have tended toward more positive outcomes as the length of the holding period increases. That is…the market has always gone up over time.
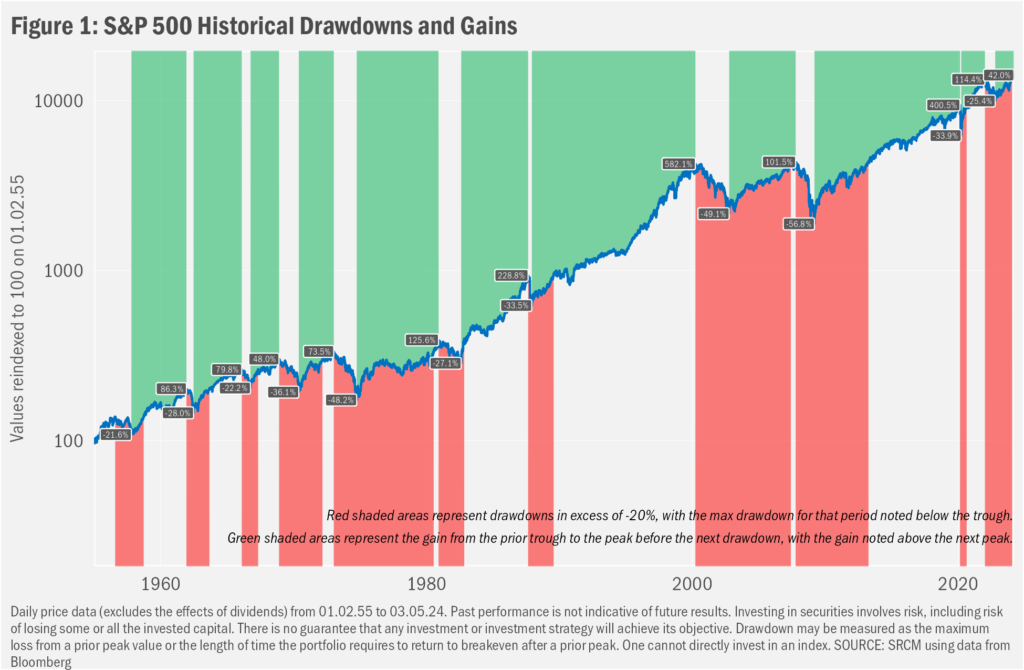
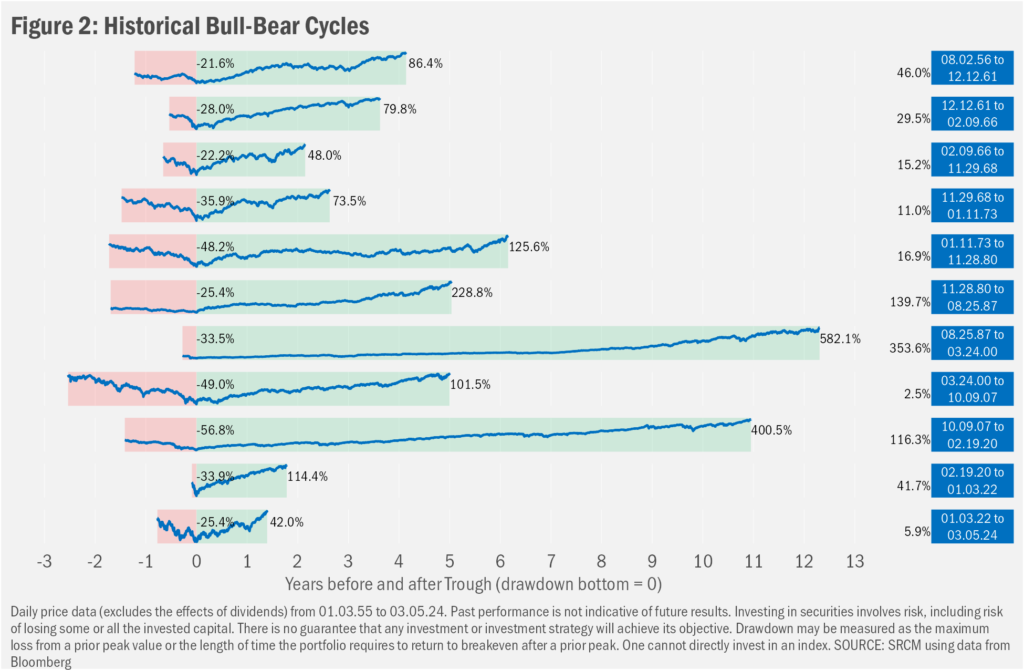
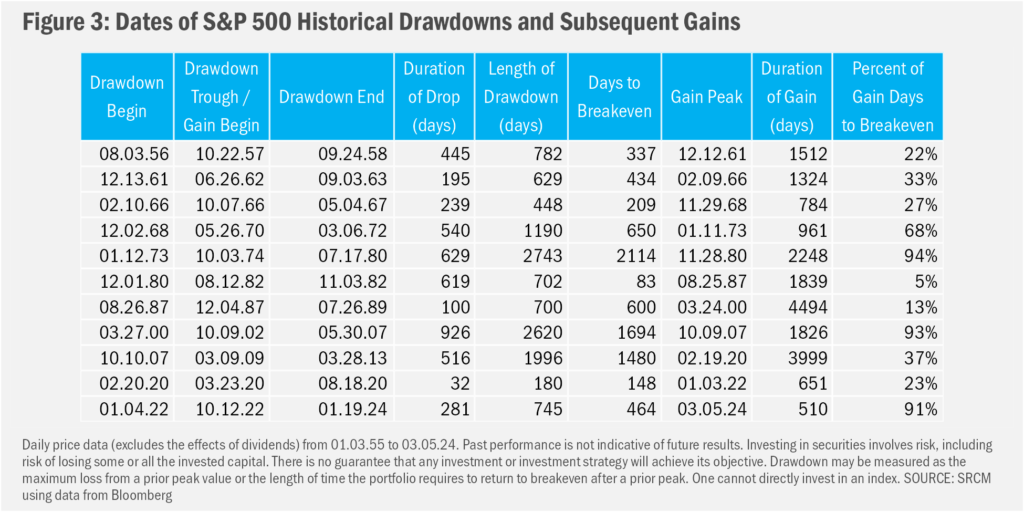
But the paths up from each interim down in the aggregate demonstrate no obvious characteristics in terms of duration or magnitude. As we show in Figure 2 and Figure 3, the major market drawdowns since World War II (declines of 20% or more, generally deemed a “bear” market) have varied widely in the depths reached, from the barely-a-bear 21.6% drop in 1957 to the 56.8% plunge during the Financial Crisis of 2007-08. As varied, have been the gains subsequent to the troughs. Those looking for an obvious reason for the market to pull back from the relatively minor 42.0% to-date gain from the 10.12.22 market trough won’t find one in these data.
Not “Due” ? Not Possible
Our skeptical take on the market prognostications of others, nonetheless, should not be read as confidence that gains will continue uninterrupted. Perhaps not so obvious in Figure 2 are the interim declines in between bull-market peaks. Let’s not forget, too, that the market barely regained a prior market peak in October 2007 before beginning its most dramatic slide in post-War history (the column of percentages at the right shows the full-cycle price return of the index). The upshot: investors should be braced for volatility and drawdown at all times—regardless of the market’s level or direction and pace of change—adjusting portfolio exposure to market risk to match comfort with potential declines.
Important Information
Signature Resources Capital Management, LLC (SRCM) is a Registered Investment Advisor. Registration of an investment adviser does not imply any specific level of skill or training. The information contained herein has been prepared solely for informational purposes. It is not intended as and should not be used to provide investment advice and is not an offer to buy or sell any security or to participate in any trading strategy. Any decision to utilize the services described herein should be made after reviewing such definitive investment management agreement and SRCM’s Form ADV Part 2A and 2Bs and conducting such due diligence as the client deems necessary and consulting the client’s own legal, accounting and tax advisors in order to make an independent determination of the suitability and consequences of SRCM services. Any portfolio with SRCM involves significant risk, including a complete loss of capital. The applicable definitive investment management agreement and Form ADV Part 2 contains a more thorough discussion of risk and conflict, which should be carefully reviewed prior to making any investment decision. All data presented herein is unaudited, subject to revision by SRCM, and is provided solely as a guide to current expectations.
The S&P 500 Index measures the performance of the large-cap segment of the U.S. equity market.
The opinions expressed herein are those of SRCM as of the date of writing and are subject to change. The material is based on SRCM proprietary research and analysis of global markets and investing. The information and/or analysis contained in this material have been compiled, or arrived at, from sources believed to be reliable; however, SRCM does not make any representation as to their accuracy or completeness and does not accept liability for any loss arising from the use hereof. Some internally generated information may be considered theoretical in nature and is subject to inherent limitations associated thereby. Any market exposures referenced may or may not be represented in portfolios of clients of SRCM or its affiliates, and do not represent all securities purchased, sold or recommended for client accounts. The reader should not assume that any investments in market exposures identified or described were or will be profitable. The information in this material may contain projections or other forward-looking statements regarding future events, targets or expectations, and are current as of the date indicated. There is no assurance that such events or targets will be achieved. Thus, potential outcomes may be significantly different. This material is not intended as and should not be used to provide investment advice and is not an offer to sell a security or a solicitation or an offer, or a recommendation, to buy a security. Investors should consult with an advisor to determine the appropriate investment vehicle.